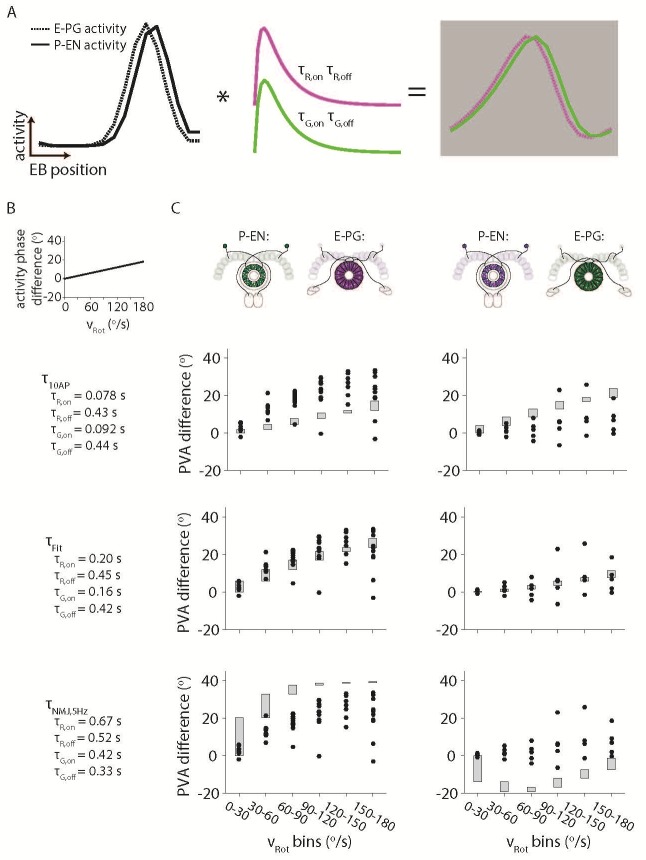
Author response image 1. Simulating the effects of the Ca2+ time constants on the observed bump activity.
(A) Overview of the procedure for convolving a simulated activity profile with on and off GECI time constants. The bump profiles are assumed to be Gaussians with full width at half maxima of 90o. Those profiles are then convolved with the difference between a decaying exponential with time constant τon and a decaying exponential with time constant τoff to create a final simulated activity profile. (B) The phase difference between the simulated P-EN Gaussian bump and the simulated E-PG Gaussian bump was assumed to vary linearly with the rotational velocity. (C) The simulated phase difference of the activity bumps after being convolved with a variety of time constants. (Top) The time constants are assumed to be those measured after exciting dissociated mouse neurons with 10 action potentials (Chen et al., 2013) (Dana et al., 2016) (Middle). Time constants chosen to best fit the data. (Bottom) The time constants are assumed to be those measured after exciting neurons in the larval Drosophila neuromuscular junction at 5 Hz (Dana et al., 2016). For the left columns, the P-EN neurons are assumed to express the green GECI, GCaMP6f, while the E-PG neurons are assumed to express the red GEC, jRGECO1a. The opposite colors are assumed to have been used at right.

