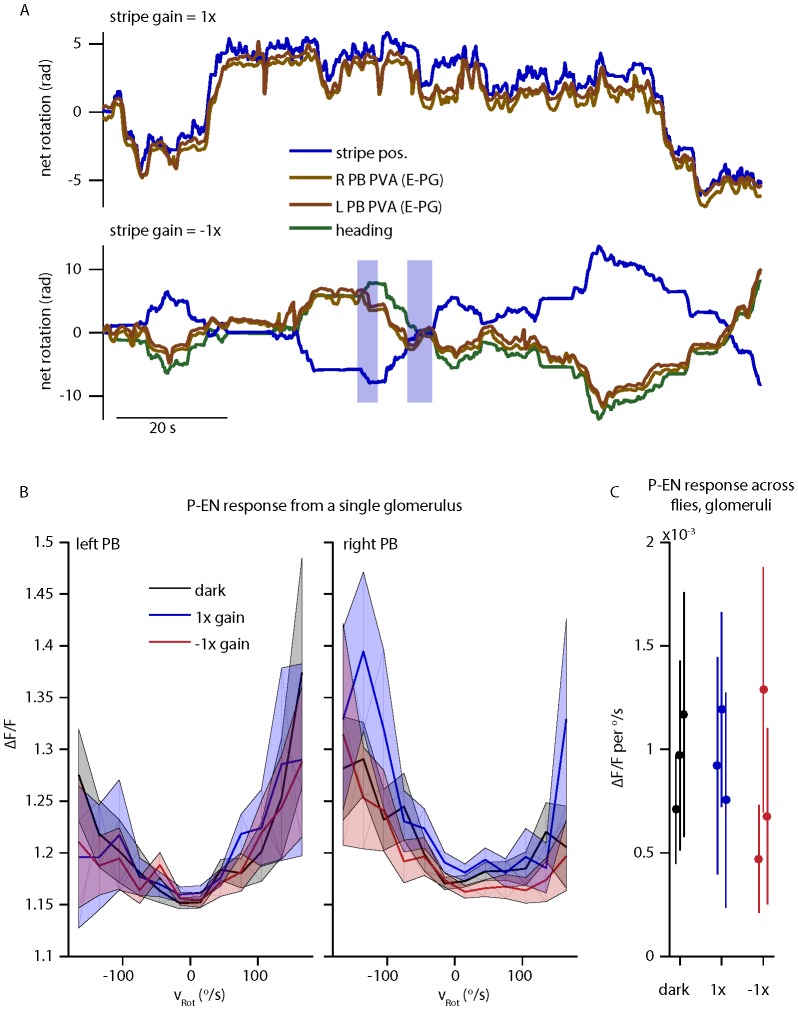
Author response image 2. P-EN and E-PG activity in the protocerebral bridge while the fly controls a 15o wide stripe with a gain of -1.
(A) Left and right E-PG bump position, as measured by the bump PVA, for a fly viewing a closed loop strip with a gain of 1 (top) and a gain of -1 (bottom) as compared to the position of the visual stripe and to the fly’s heading. (B) The mean and standard deviation of the left and right P-EN activity in the protocerebral bridge as a function of rotational velocity when the fly is in the dark or viewing a stipe with a gain of 1 or -1 for one fly. (C) Mean (dot) and standard deviation (line) of the mean ipsilatateral P-EN activity (from 0-150 o/s) across flies.

