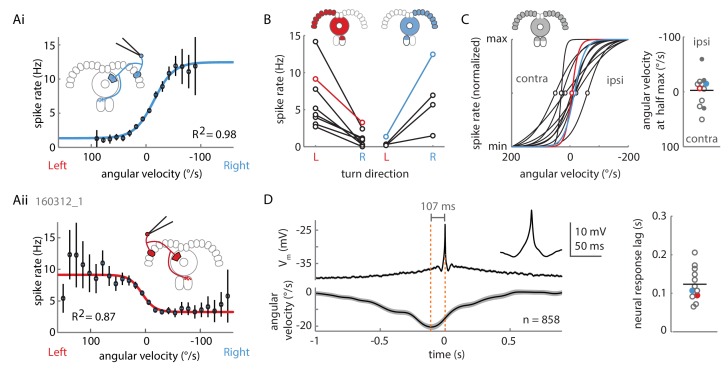
Figure 4. Two P-EN subpopulations mirror-symmetrically encode the fly’s rotational velocity.
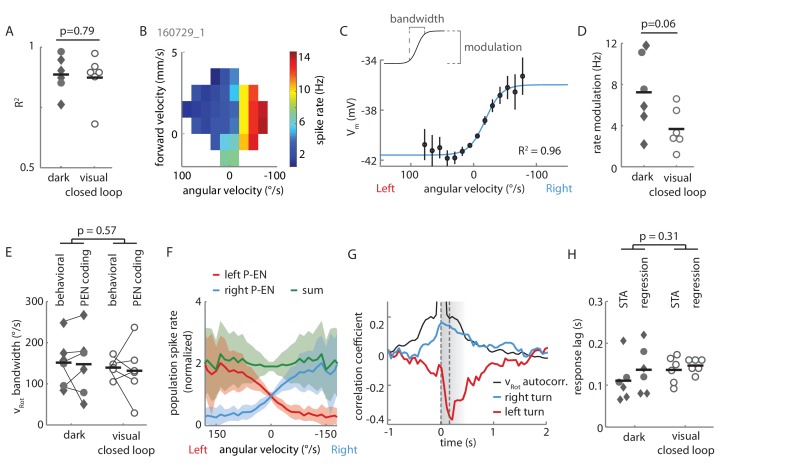
(A) Example tuning curves of P-EN spike rate to the fly’s rotations as the fly walks in darkness. Angular velocities were binned in 12°/s bins and a sigmoid was fitted with bin counts used as weights (see Materials and methods for details). Mean spike rate and 95% confidence interval in black, sigmoidal fits in blue and red. (Ai) Tuning curve for a right P-EN neuron (same as in Figure 3). P-EN membrane potential changes were similar to the observed changes in spike rates (see Figure 4—figure supplement 1C for Vm tuning curve). (Aii) Tuning curve for a left P-EN neuron (see Figure 4—figure supplement 2A for example trace). (B) Fitted spike rates for the flies’ turns to the left versus right illustrate mirror-symmetric tuning properties of the left and right P-EN subpopulations. Spike rates were computed either at saturation or at an absolute rotational velocity of 200°/s, whichever was lower. Example cells from panel A are color coded. (C) Encoding of rotations by the two subpopulations is mirror-symmetric yet overlapping, that is, each P-EN subpopulation encodes rotations in both directions. Left: Normalized tuning curve fits for all P-EN neurons. Left hemisphere P-EN curves have been reflected for simplicity. Neurons plotted in A are color coded for comparison. Open circles mark each sigmoid’s half-maximum (inflexion point). Right: On average, the P-EN neurons’ receptive field for rotations is centered around 0°/s, where P-EN’s are half-maximally activated. Closed and open circles in the right subplot represent inflexion points of right and left P-EN tuning curves, respectively. Example cells from panel A are in blue and red. (D) Spike-triggered averages of angular velocities were constructed to characterize P-EN timing. Since P-EN neurons tend to spike at rest, all spikes with rotational velocities not exceeding 40°/s at any time in a one second window around the spike were excluded. Left: Membrane potential is plotted at top, angular velocity at bottom. Inset shows a magnification of the average spike shape. Right: The peak of the angular velocity precedes the spike in all P-ENs recorded. Example cells from panel A are in blue and red.


