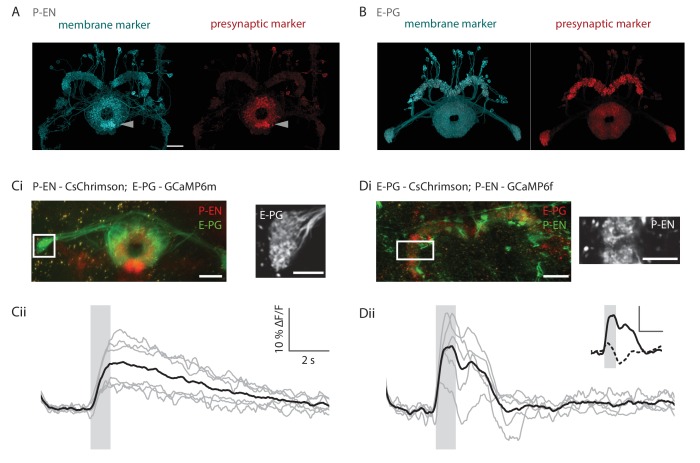
Figure 7. Functional connectivity of E-PG and P-EN neurons.
(A) P-EN neuron membranes and presynaptic sites are labeled by expressing myr-sm::GFP and synaptotagmin in VT008135-GAL4, a second genetic line that drives expression in the P-EN neurons. While additional central complex and central brain cell types are targeted in this line, only the P-EN neuron arborizes in the protocerebral bridge (see Materials and methods). Expression is evident in the protocerebral bridge, the ellipsoid body and the paired noduli (behind the ellipsoid body, labelled by arrowhead). Intensity of presynaptic labeling was strongest in the ellipsoid body. The scale bar is 20 μm and applies to A and B. Though the image stack was rotated in three dimensions to obtain the included view, the scale bar was obtained from a single plane of the imaging stack. (B) Analogous to A, but using R60D05-GAL4 to drive expression in the E-PG neurons. Although presynaptic labeling was most intense in the protocerebral bridge and gall, synaptotagmin was also detected in the ellipsoid body, suggesting E-PG presynaptic sites in that neuropil as well. (C) Functional connectivity experiment with CsChrimson-mCherry expressed in P-EN, and GCaMP6m in E-PG neurons. (Ci) (Left) Average projection of fluorescence from a dissected brain. Both E-PG and P-EN arborizations can be seen in the ellipsoid body. E-PGs furthermore project to the gall (box, left) and P-ENs to the noduli (paired structure at bottom). (Right) Average frame from imaging the E-PGs in the gall while activating the P-ENs. (Cii) Average response (in black) from six flies to a train of 2 ms, 590 nm light pulses delivered at 30 Hz and 50 μW/mm2. Stimulation time indicated by gray area. Gray traces correspond to the average of 4 trials for individual flies. (D) Functional connectivity experiment with CsChrimson-mCherry expressed in E-PG and GCaMP6f in P-EN neurons. (Di) (Left) Average projection of fluorescence from a dissected brain. (Right) Average frame from imaging the P-ENs in the protocerebral bridge while activating the E-PGs. (Dii) Analogous to Cii, except that stimulation light intensity was increased to 500 μW/mm2. (inset) Comparison of low stimulation intensity responses (50 μW/mm2, dotted line) and the high stimulation responses shown in the plot below (solid line). These responses were acquired in different regions (low stimulation: noduli, high stimulation: protocerebral bridge), but results were consistent across neuropiles. The scale bars are scaled versions of those shown in Cii. All scale bars in Ci, Di: 10 µm.

