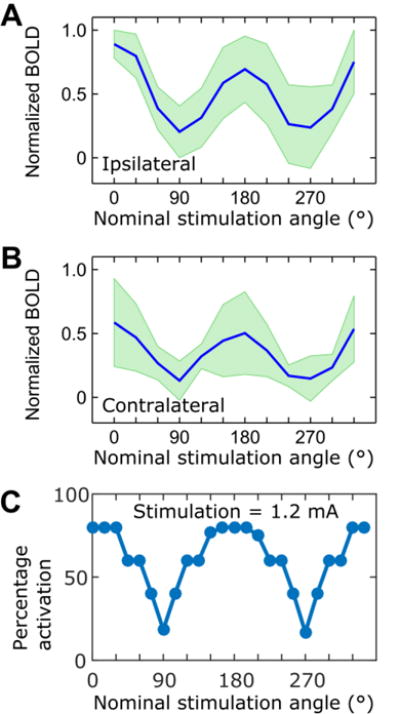
Figure 4.

Dependence of the (A) ipsilateral and (B) contralateral mean BOLD contrast on the nominal stimulation angle. Maximal BOLD contrast was observed for the orientation of 0° between the electric field and CC fibers, while reduced activation was detected upon re-orientation of the electric field anti-parallel (180°) to the axonal tracks; (C) Activation percentages for simulated axons placed radially below the tripolar electrode using a stimulation current of 1.2 mA. See Fig. 2 for the detailed description of the axon placement. SDs are indicated in green (n = 12).
