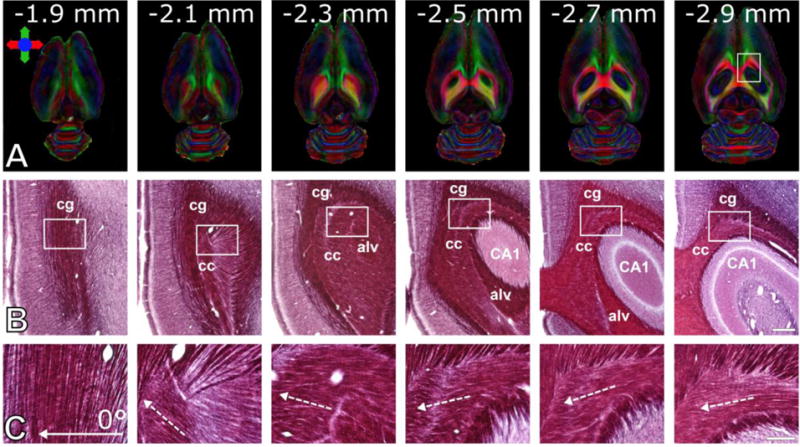
Figure 5.

Variability of axonal directions in a rat. (A) Horizontal slices of directionally encoded color-fractional anisotropy maps obtained using DTI. Colors indicate principle directions of the water diffusion. Numbers indicate the distance of the images from the brain surface. (B) Photomicrographs of myelin stained sections of the same rat brain shown in panel (A). White rectangles represent the frames of the high magnification photomicrographs shown in panel C. Full arrow indicates the stimulation angle 0° used in the experiments, dashed arrows indicate direction of the axons. Abbreviations: cc = corpus callosum, cg = cingulum, alv = alveus, CA1 = hippocampal area CA1. Scale bars: 500 μm (B) and 150 μm (C).
