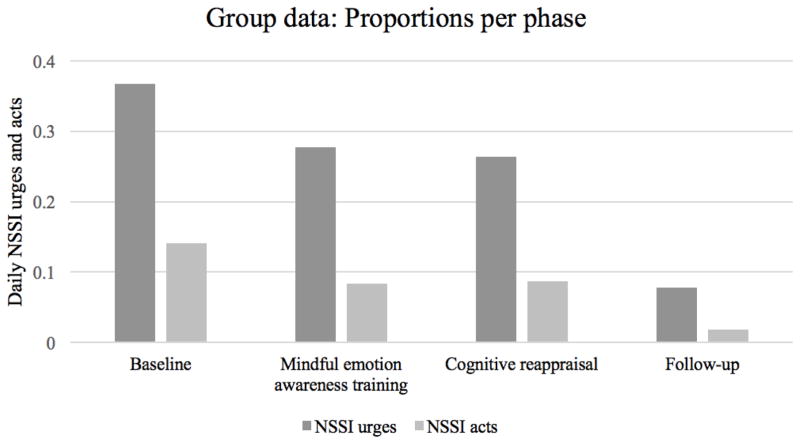
Figure 4.
Group data based on N = 855 daily observations. Bars indicate proportions of NSSI urges and acts per phase. Pairwise phase comparisons showed statistically significant differences between proportions of NSSI urges and NSSI acts in the baseline phase compared to all three subsequent phases (baseline > all other phases), and the follow-up phase compared to all three previous phases (follow-up < all other phases). There were no differences between the two intervention phases.

