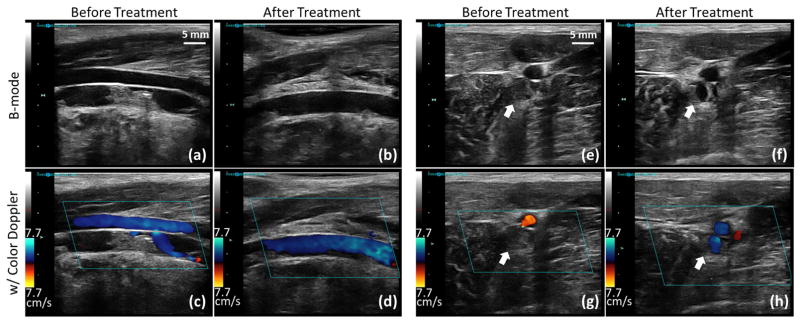
Figure 5.
Representative US B-mode images (first row) and color Doppler images (second row) taken before and right after microtripsy thrombolysis treatment in an acute pig. (a)–(d): Longitudinal sections of the femoral vein. (e)–(h): Cross sections of the femoral veins (indicated by the block arrows).

