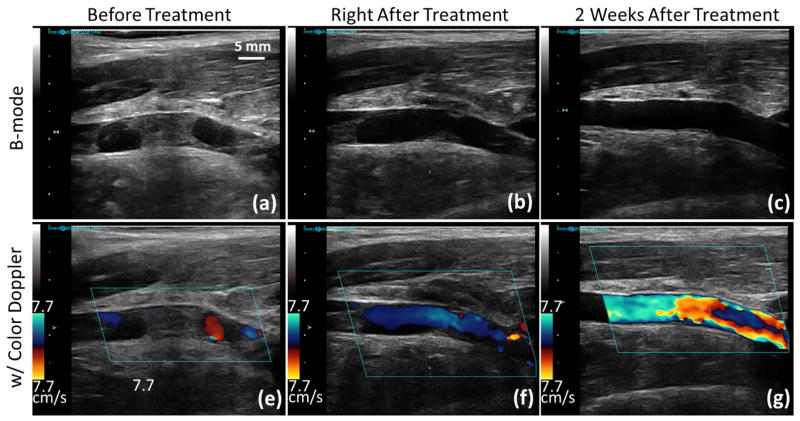
Figure 6.
Representative US B-mode images (first row) and color Doppler images (second row) taken before, right after and two weeks after microtripsy thrombolysis treatment in a subacute pig. Blood flow was increased after two weeks of recovery compared to that right after the treatment. Since a relatively smaller velocity scale was chosen to be consistent throughout all the color Doppler images, velocity aliasing occurred on the two-week color Doppler image (g) with an increased blood flow.

