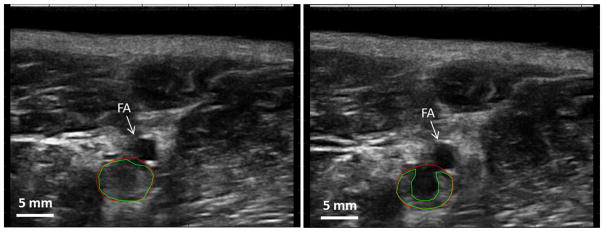
Figure 7.
Quantification of flow channel generated by microtripsy. On the left is the ultrasound image taken before treatment. On the right is the ultrasound image taken at the exact same location right after treatment. Green lines indicate the boundaries of the thrombi and red lines indicate the vessel lumen.

