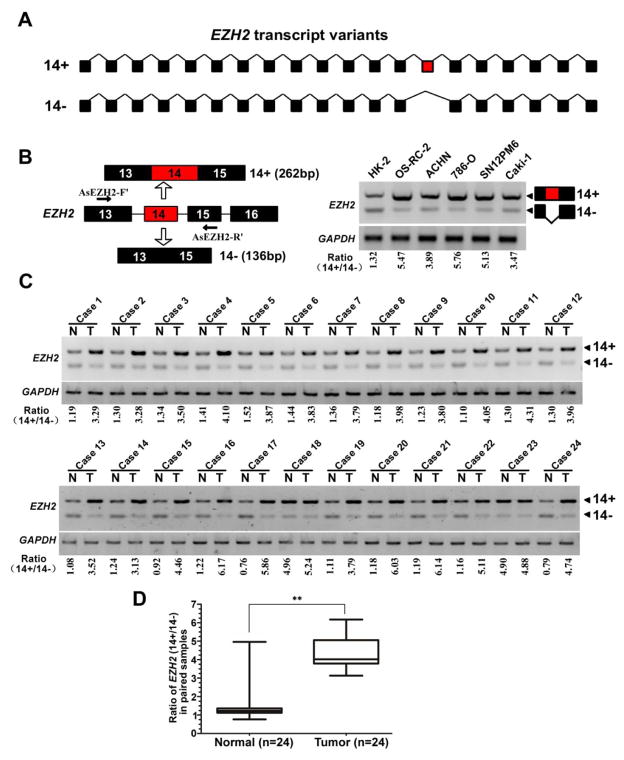
Fig. 1. EZH2 exon 14 inclusion is upregulated in renal cancers.
(A) Schematic representation of the EZH2 exon structure to highlight the alternative splicing between exons 13 and 15 generating EZH2-14+ (EZH2) and EZH2-14− (EZH2Δ14) variants. (B) Left: diagrams for detection of EZH2-14+ and EZH2-14− mRNA. Primer pairs and product sizes for the two variants are shown. Right: Expression of EZH2-14+ and EZH2-14− mRNA in one normal kidney proximal tubular epithelial cell line (HK2) and five cancer cell lines (OS-RC-2, ACHN, 786-O, SN12PM6, Caki-1) by RT PCR. Ratio for 14+/14− is listed below the panel. (C) Expression of EZH2-14+ and EZH2-14− mRNA in 24 paired renal cancer tissues and adjacent non-tumor tissues by RT-PCR. GAPDH transcript level was used as the load control. (D) Quantification of data from c for exon14 inclusion/exclusion ratio. ** indicates significant differences, P < 0.01.

