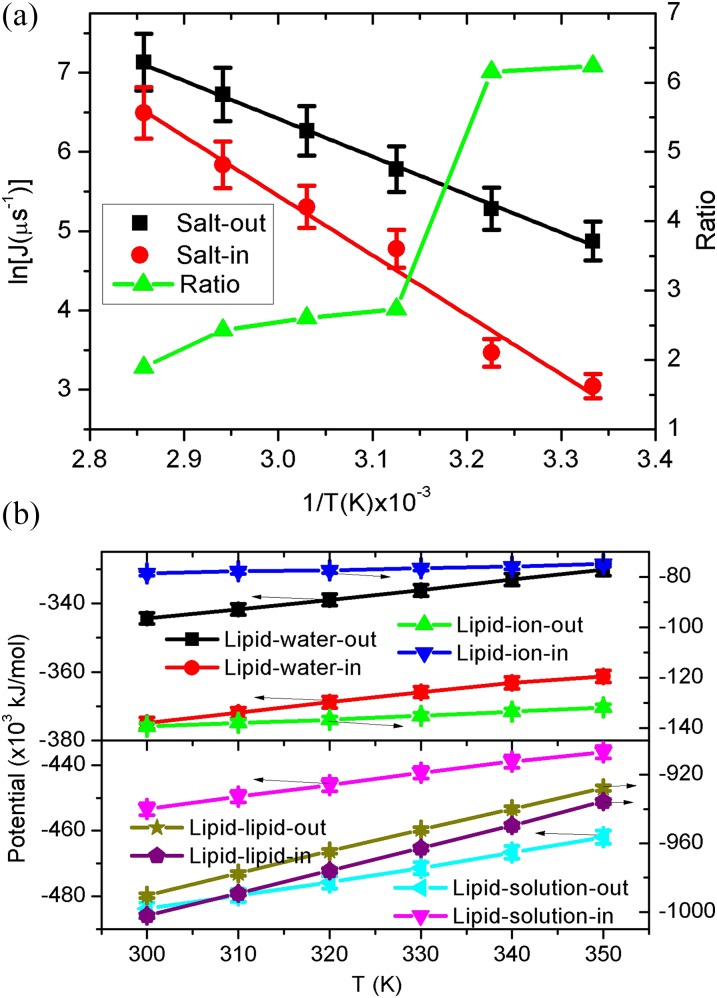
FIG. 3.
(a) Arrhenius plots of the water flux and temperature. Herein, the vesicle is under a given size (outside diameter R = 28 nm) and salt concentration (c = 2M). Lines are linear fittings for the same color data. (b) The corresponding potential energy of lipid-ion, lipid-water, lipid-solution, and lipid-lipid as a function of the temperature.

