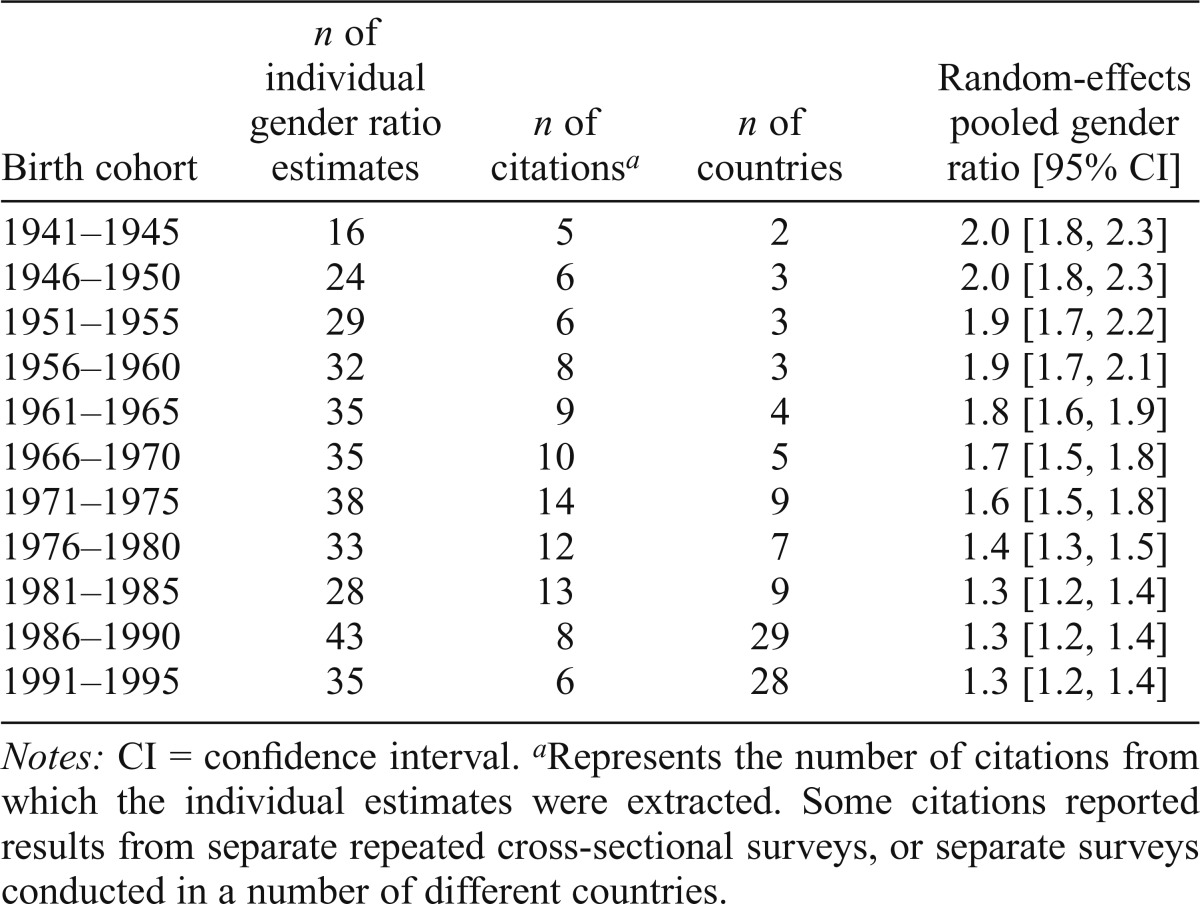
Table 2.
Random-effects meta-analysis pooled gender ratios for prevalence of any cannabis use within 5-year birth cohorts
| Birth cohort | n of individual gender ratio estimates | n of citationsa | n of countries | Random-effects pooled gender ratio [95% CI] |
| 1941–1945 | 16 | 5 | 2 | 2.0 [1.8, 2.3] |
| 1946–1950 | 24 | 6 | 3 | 2.0 [1.8, 2.3] |
| 1951–1955 | 29 | 6 | 3 | 1.9 [1.7, 2.2] |
| 1956–1960 | 32 | 8 | 3 | 1.9 [1.7, 2.1] |
| 1961–1965 | 35 | 9 | 4 | 1.8 [1.6, 1.9] |
| 1966–1970 | 35 | 10 | 5 | 1.7 [1.5, 1.8] |
| 1971–1975 | 38 | 14 | 9 | 1.6 [1.5, 1.8] |
| 1976–1980 | 33 | 12 | 7 | 1.4 [1.3, 1.5] |
| 1981–1985 | 28 | 13 | 9 | 1.3 [1.2, 1.4] |
| 1986–1990 | 43 | 8 | 29 | 1.3 [1.2, 1.4] |
| 1991–1995 | 35 | 6 | 28 | 1.3 [1.2, 1.4] |
Notes: CI = confidence interval.
Represents the number of citations from which the individual estimates were extracted. Some citations reported results from separate repeated cross-sectional surveys, or separate surveys conducted in a number of different countries.

