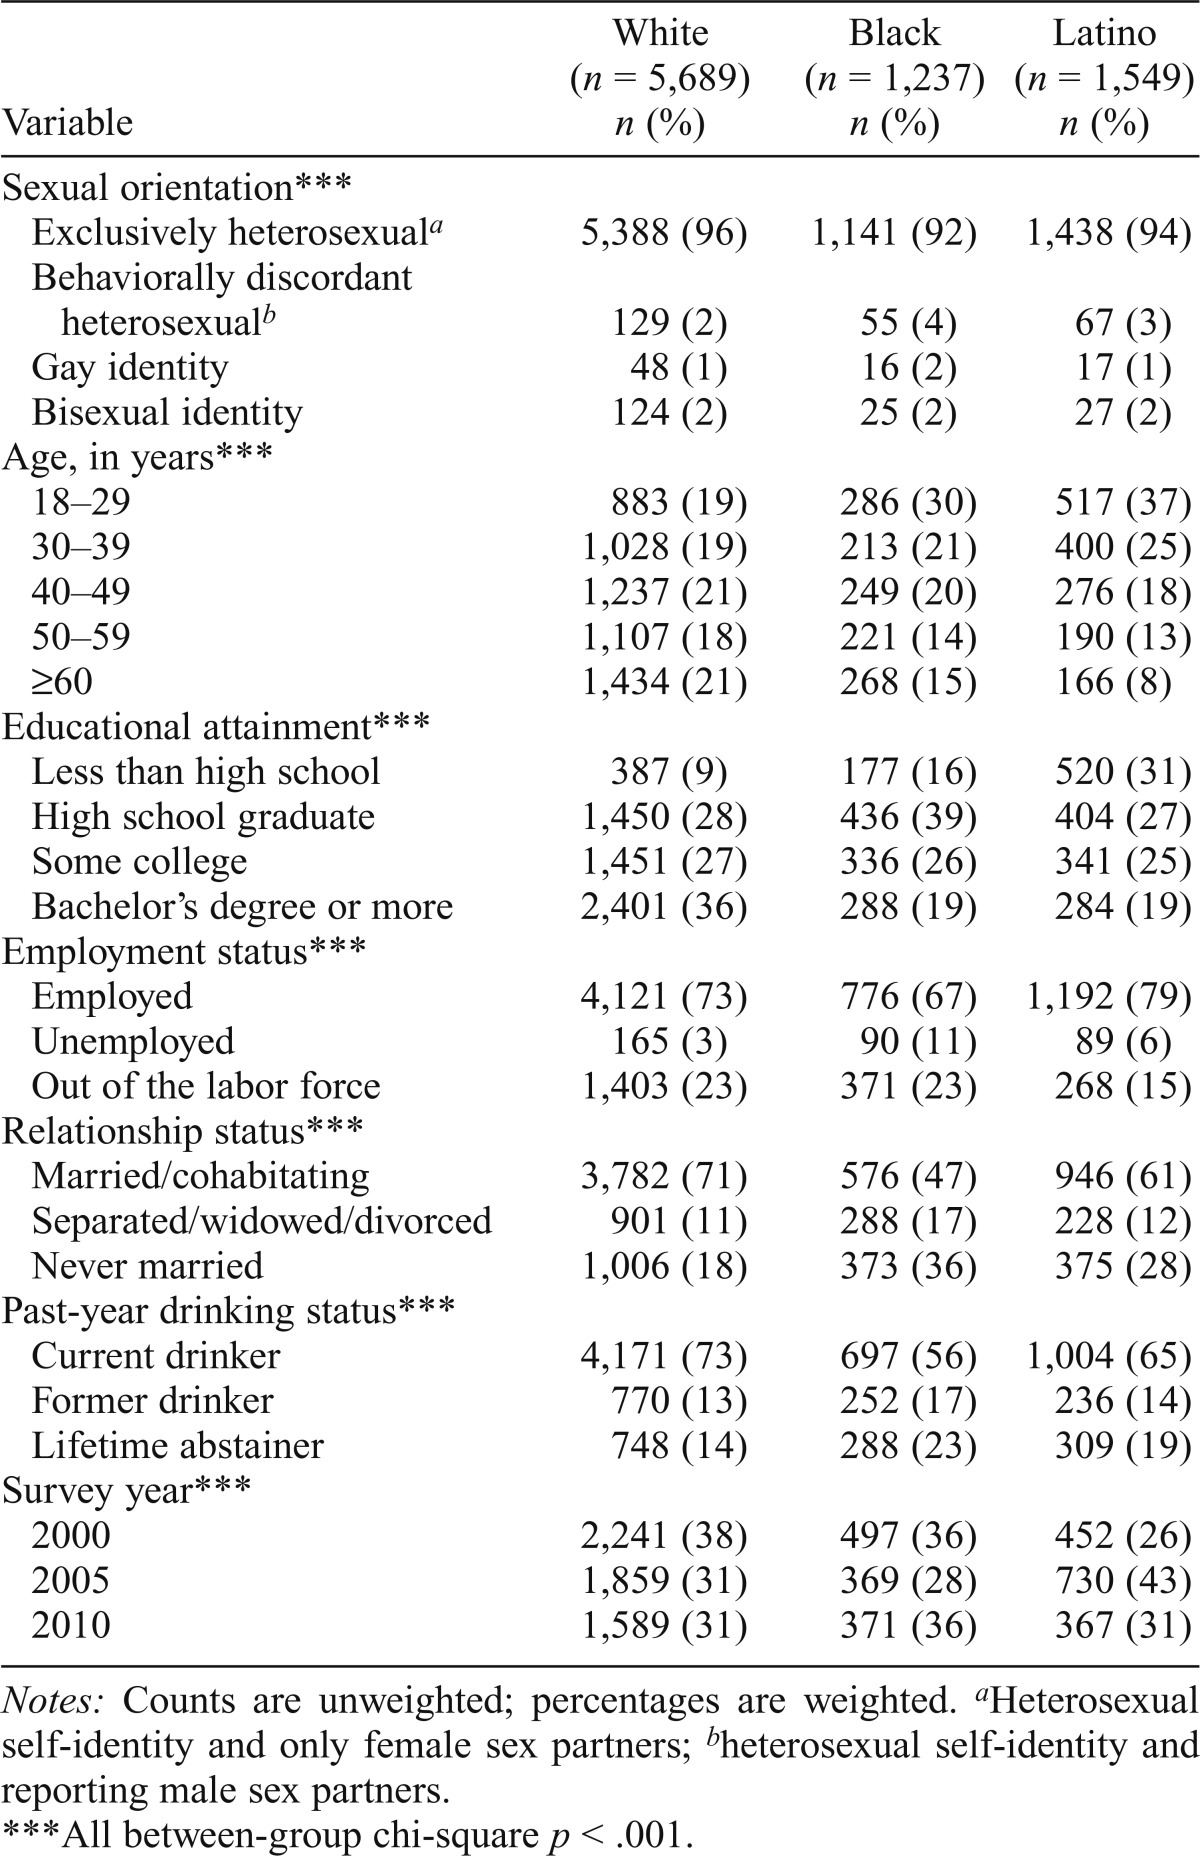
Table 1.
Sample characteristics of male respondents in three waves of the National Alcohol Survey (2000–2010) by race/ethnicity
| Variable | White (n = 5,689) n (%) | Black (n = 1,237) n (%) | Latino (n = 1,549) n (%) |
| Sexual orientation*** | |||
| Exclusively heterosexuala | 5,388 (96) | 1,141 (92) | 1,438 (94) |
| Behaviorally discordant heterosexualb | 129 (2) | 55 (4) | 67 (3) |
| Gay identity | 48 (1) | 16 (2) | 17 (1) |
| Bisexual identity | 124 (2) | 25 (2) | 27 (2) |
| Age, in years*** | |||
| 18–29 | 883 (19) | 286 (30) | 517 (37) |
| 30–39 | 1,028 (19) | 213 (21) | 400 (25) |
| 40–49 | 1,237 (21) | 249 (20) | 276 (18) |
| 50–59 | 1,107 (18) | 221(14) | 190 (13) |
| ≥60 | 1,434 (21) | 268 (15) | 166(8) |
| Educational attainment*** | |||
| Less than high school | 387 (9) | 177(16) | 520 (31) |
| High school graduate | 1,450 (28) | 436 (39) | 404 (27) |
| Some college | 1,451 (27) | 336 (26) | 341 (25) |
| Bachelor’s degree or more | 2,401 (36) | 288 (19) | 284(19) |
| Employment status*** | |||
| Employed | 4,121 (73) | 776 (67) | 1,192 (79) |
| Unemployed | 165 (3) | 90(11) | 89 (6) |
| Out of the labor force | 1,403 (23) | 371 (23) | 268 (15) |
| Relationship status*** | |||
| Married/cohabitating | 3,782 (71) | 576 (47) | 946 (61) |
| Separated/widowed/divorced | 901(11) | 288 (17) | 228 (12) |
| Never married | 1,006 (18) | 373 (36) | 375 (28) |
| Past-year drinking status*** | |||
| Current drinker | 4,171 (73) | 697 (56) | 1,004 (65) |
| Former drinker | 770 (13) | 252(17) | 236(14) |
| Lifetime abstainer | 748 (14) | 288 (23) | 309(19) |
| Survey year*** | |||
| 2000 | 2,241 (38) | 497 (36) | 452 (26) |
| 2005 | 1,859 (31) | 369 (28) | 730 (43) |
| 2010 | 1,589 (31) | 371 (36) | 367 (31) |
Notes: Counts are unweighted; percentages are weighted.
Heterosexual self-identity and only female sex partners;
heterosexual self-identity and reporting male sex partners.
All between-group chi-squarep < .001.

