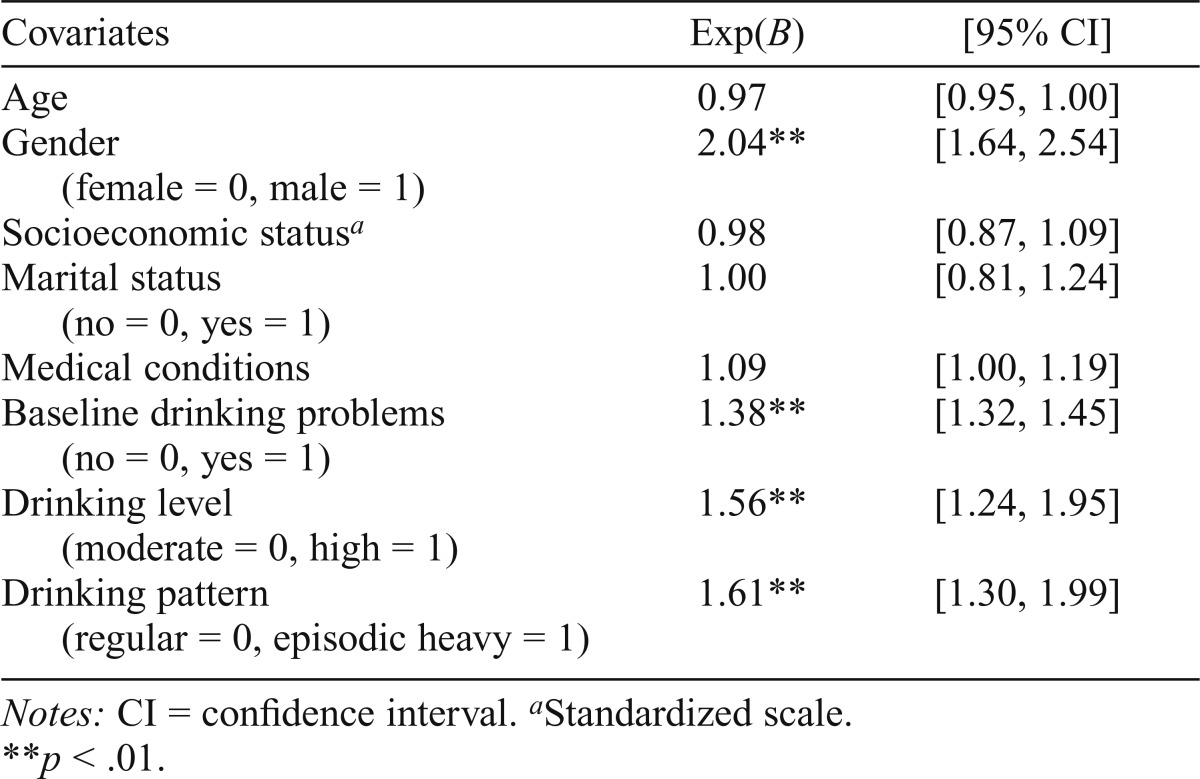
Table 2.
Results of a negative binomial regression analysis with drinking level and drinking pattern at baseline prospectively predicting the number of drinking problems at the 1-year follow-up (N = 1,063)
| Covariates | Exp(B) | [95% CI] |
| Age | 0.97 | [0.95, 1.00] |
| Gender | 2.04** | [1.64, 2.54] |
| (female = 0, male = 1) | ||
| Socioeconomic statusa | 0.98 | [0.87, 1.09] |
| Marital status | 1.00 | [0.81, 1.24] |
| (no = 0, yes = 1) | ||
| Medical conditions | 1.09 | [1.00, 1.19] |
| Baseline drinking problems | 1.38** | [1.32, 1.45] |
| (no = 0, yes = 1) | ||
| Drinking level | 1.56** | [1.24, 1.95] |
| (moderate = 0, high = 1) | ||
| Drinking pattern | 1.61** | [1.30, 1.99] |
| (regular = 0, episodic heavy = 1) |
Notes: CI = confidence interval.
Standardized scale.
p < .01.

