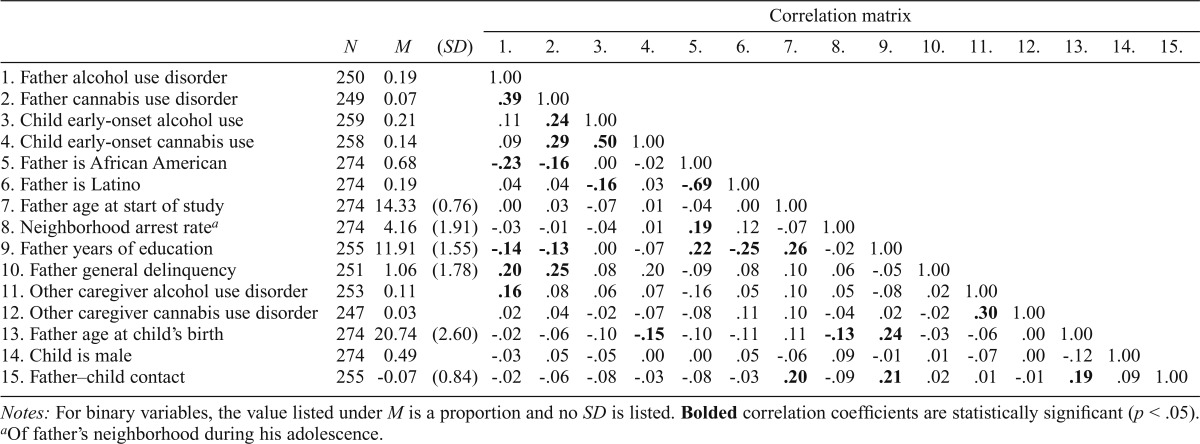
Table 1.
Descriptive statistics and correlation matrix for all study variables
| N | M | (SD) | Correlation matrix |
|||||||||||||||
| 1. | 2. | 3. | 4. | 5. | 6. | 7. | 8. | 9. | 10. | 11. | 12. | 13. | 14. | 15. | ||||
| 1. Father alcohol use disorder | 250 | 0.19 | 1.00 | |||||||||||||||
| 2. Father cannabis use disorder | 249 | 0.07 | .39 | 1.00 | ||||||||||||||
| 3. Child early-onset alcohol use | 259 | 0.21 | .11 | .24 | 1.00 | |||||||||||||
| 4. Child early-onset cannabis use | 258 | 0.14 | .09 | .29 | .50 | 1.00 | ||||||||||||
| 5. Father is African American | 274 | 0.68 | -.23 | -.16 | .00 | -.02 | 1.00 | |||||||||||
| 6. Father is Latino | 274 | 0.19 | .04 | .04 | -.16 | .03 | -.69 | 1.00 | ||||||||||
| 7. Father age at start of study | 274 | 14.33 | (0.76) | .00 | .03 | -.07 | .01 | -.04 | .00 | 1.00 | ||||||||
| 8. Neighborhood arrest ratea | 274 | 4.16 | (1.91) | -.03 | -.01 | -.04 | .01 | .19 | .12 | -.07 | 1.00 | |||||||
| 9. Father years of education | 255 | 11.91 | (1.55) | -.14 | -.13 | .00 | -.07 | .22 | -.25 | .26 | -.02 | 1.00 | ||||||
| 10. Father general delinquency | 251 | 1.06 | (1.78) | .20 | .25 | .08 | .20 | -.09 | .08 | .10 | .06 | -.05 | 1.00 | |||||
| 11. Other caregiver alcohol use disorder | 253 | 0.11 | .16 | .08 | .06 | .07 | -.16 | .05 | .10 | .05 | -.08 | .02 | 1.00 | |||||
| 12. Other caregiver cannabis use disorder | 247 | 0.03 | .02 | .04 | -.02 | -.07 | -.08 | .11 | .10 | -.04 | .02 | -.02 | .30 | 1.00 | ||||
| 13. Father age at child’s birth | 274 | 20.74 | (2.60) | -.02 | -.06 | -.10 | -.15 | -.10 | -.11 | .11 | -.13 | .24 | -.03 | -.06 | .00 | 1.00 | ||
| 14. Child is male | 274 | 0.49 | -.03 | .05 | -.05 | .00 | .00 | .05 | -.06 | .09 | -.01 | .01 | -.07 | .00 | -.12 | 1.00 | ||
| 15. Father–child contact | 255 | -0.07 | (0.84) | -.02 | -.06 | -.08 | -.03 | -.08 | -.03 | .20 | -.09 | .21 | .02 | .01 | -.01 | .19 | .09 | 1.00 |
Notes: For binary variables, the value listed under M is a proportion and no SD is listed. Bolded correlation coefficients are statistically significant (p < .05).
Of father’s neighborhood during his adolescence.

