
Figure 6.
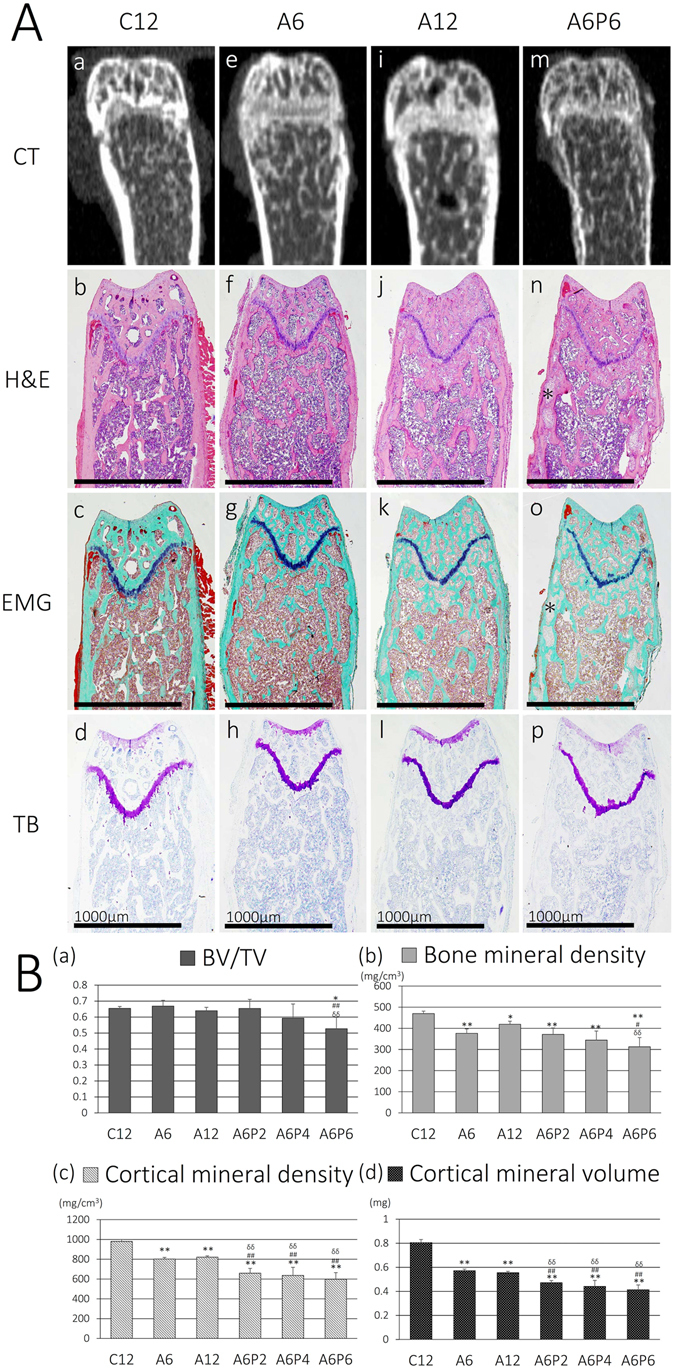
Representative histological images of the distal thighbone and morphometric parameters of distal femoral metaphysis. (A) Histological images from the control (C12; b–d), A6 (f–h), A12 (j–l), and A6P6 (n–p) groups are shown. For the CKD-HP groups, images from A6P6 mice are shown, with the greatest evidence of the characteristic changes in the CKD-HP groups. Although changes in the morphology of the diaphysis and irregularity of cortical bones was evident in all CKD groups (e–p), these changes were particularly strong among CKD-HP mice (m–p), with evidence of some cortical regions replaced by loose tissues (n,o; asterisk, *). Scale bar, 1000 μm. (B) Morphometric parameters (BV/TV, BMD, CMD, and CMV) were calculated through analysis of CT images, to identify most depressed morphometric parameters in the CKD-HP groups. CT, computed tomography; H&E, hematoxylin and eosin; EMG, elastica Masson-Goldner; TB, toluidine blue; BV/TV, bone volume/tissue volume; BMD, bone mineral density; CMD, cortical mineral density; CMV, cortical mineral volume. The data are represented as the mean ± SEM (n = 5); *P < 0.05 and **P < 0.01 versus C12; # P < 0.05 and ## P < 0.01 versus A6; δδ P < 0.01 versus A12; all P-values are evaluated by non-repeated measures ANOVA.