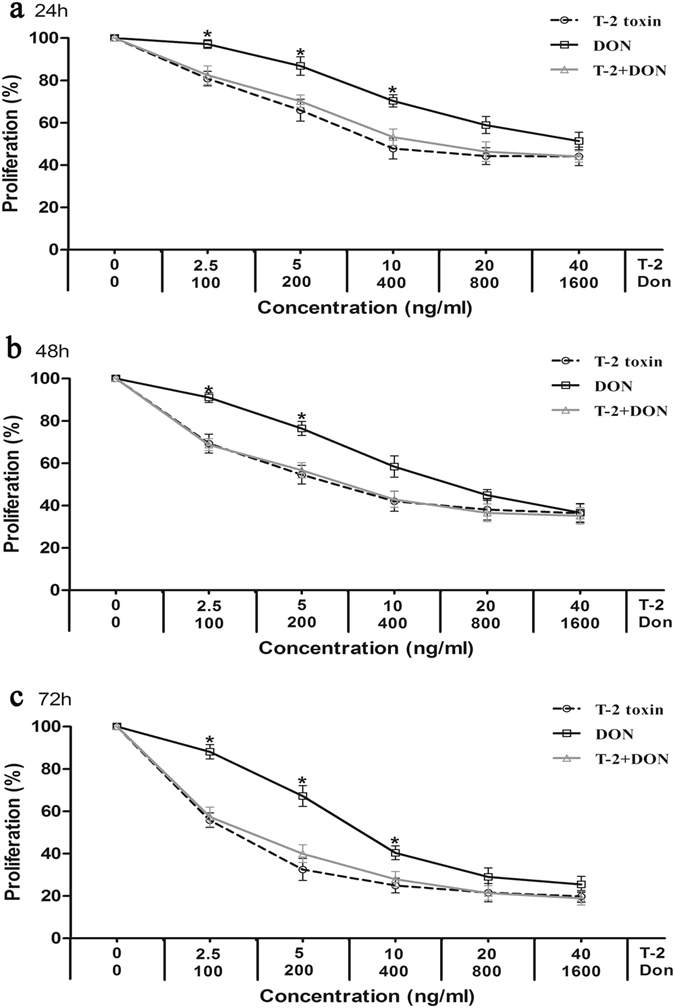
Figure 2.

Cytotoxicity T-2 toxin and/or DON in the liver-derived cell line, L-02. Cells were exposed to mycotoxins for (a) 24 h, (b) 48 h and (c) 72 h and analyzed by the MTT method, as described in Fig. 1. Each data point represents the mean ± SEM from three independent experiments with replicate samples, *p < 0.05 indicates significant differences between the mixture and T-2 toxin alone, #p < 0.05 represents significant differences between the mixture and DON alone.
