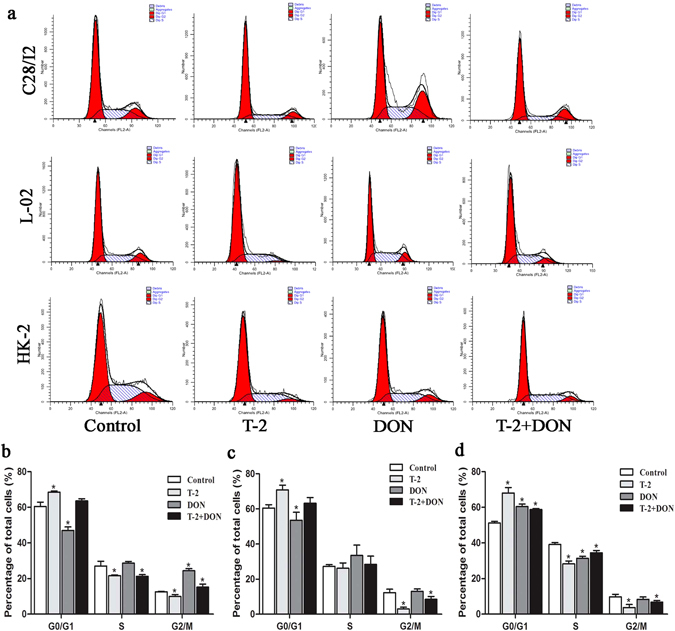
Figure 5.

Cell cycle arrest induced by T-2 toxin and/or DON. (a) C28/I2, L-02, and HK-2 cells were exposed to T-2 toxin (10 ng/ml) or DON (800 ng/ml), alone or in combination, for 24 h. and cell cycle phase distribution was analyzed by flow cytometry. Cell cycle phase distribution was quantified as the percentage of total cells in C28/I2 (b), L-02 (c), and HK-2 (d) cells. Data are represented as the mean ± SD from three independent experiments; *P < 0.05 indicates significance versus untreated control values.
