
Figure 1.
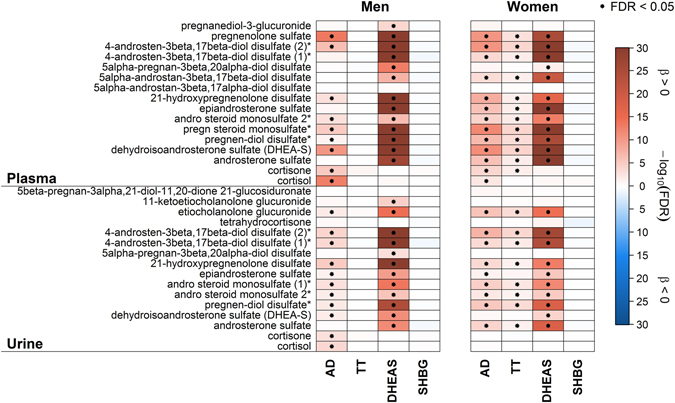
Heatmap of results from linear regression analyses with either androstenedione (AD), testosterone (TT), dehydroepiandrosterone sulfate (DHEAS) or sex hormone-binding globulin (SHBG) as exposure and steroid derivatives in plasma (upper part) or urine (lower part) as outcome in men (left panel) and women (right panel), respectively. Orange shading denotes positive and blue shading inverse associations. Dots indicate significant associations by controlling the false discovery rate (FDR) at 5%. Corresponding estimates and FDR values from linear regression analyses can be found in Tables S1–S4. *Metabolites were annotated based on fragmentation spectra.