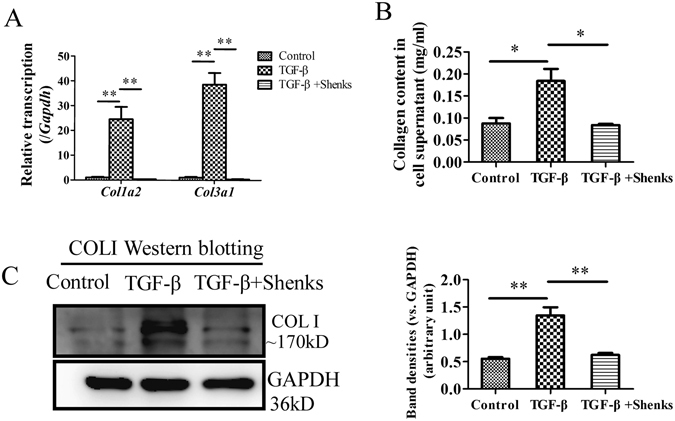
Figure 3.

Shenks inhibition on collagen production. (A) Relative transcript levels of Col1a2 and Col3a1 in murine 3T3 fibroblasts that were exposed to different treatments. The expression level of each gene in the control group was normalized to 1. (B) Collagen content was determined by Sircol assay from the supernatants of cells that underwent different treatments. (C) Western blot analysis of type I collagen (COL1) in murine 3T3 fibroblasts that were exposed to different treatments. Densitometric analysis of Western blots for type I collagen (COL1) are shown. Bars indicate the mean ± SEM results of three assays. *P < 0.05; **P < 0.001. Control = PBS treated group; TGF-β = TGF-β-treated group; TGF-β + Shenks = TGF-β and Shenks treated group.
