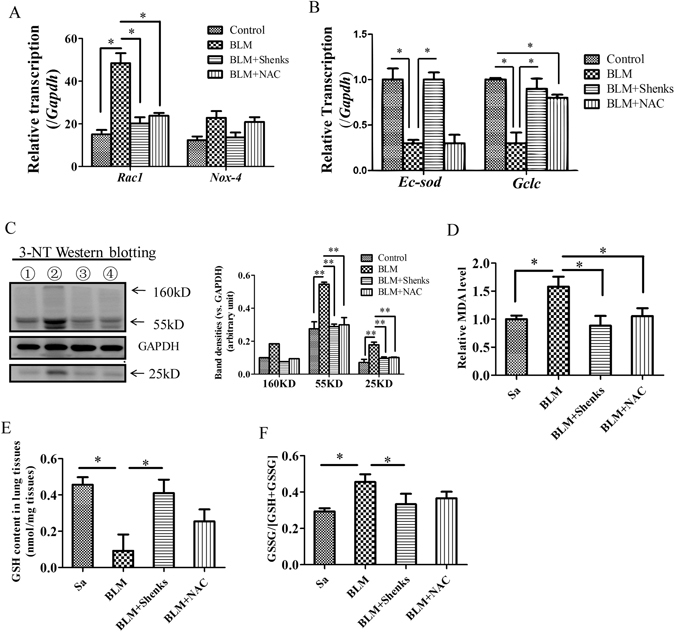
Figure 5.

Modulation of Shenks on the balance of oxidant stress in the mice lungs. (A) Relative transcript levels of Rac1 and Nox-4 in lung tissues of mice that underwent different treatment conditions. The expression level of each gene in the control group was normalized to 1. (B) Relative transcription of Ec-sod and Gclc in the lungs of mice that underwent different treatments. (C) Western blot analysis of oxidative protein damage product 3-NT in the lungs of mice that underwent different treatments and Densitometric analysis of Western blots for 3-NT. (D) Lipid peroxidation was evaluated by measuring malondialdehyde (MDA). Changes in GSH concentration (E) and the ration of GSSG/(GSH + GSSH) among various groups (F). In Figure (C), Line ① = Control; Line ② = BLM; line ③ = BLM + Shenks; line ④ = BLM + NAC. Bars indicate the mean ± SEM results of three assays. *P < 0.05; **P < 0.001. Control = Saline treated group; BLM = Bleomycin-treated group; BLM + Shenks = BLM and Shenks treated group (n = 6).
