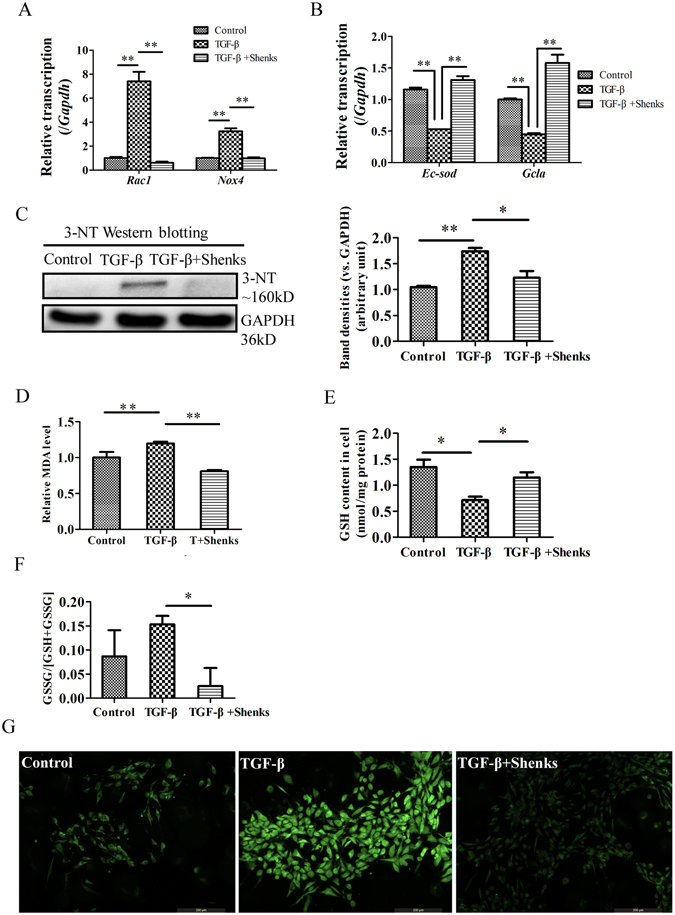
Figure 6.

Shenks-mediated modulation of the balance of oxidant stress in TGF-β-stimulated cells. (A) Relative transcript levels of Rac1 and Nox-4 in murine 3T3 fibroblasts that underwent different treatment conditions. The expression level of each gene in the control group was normalized to 1. (B) The relative transcript levels of Ec-sod and Gclc in murine 3T3 fibroblasts which also underwent different treatments. The expression levels of each gene in the control group were normalized to 1. (C) Western blot analysis of 3-NT in differentially treated murine 3T3 fibroblasts and densitometric analysis of Western blot for 3-NT. (D) Lipid peroxidation MDA levels in murine 3T3 fibroblasts underwent different treatments. Changes in GSH concentration (E) and the ratio of GSSG/(GSH + GSSH) in murine 3T3 fibroblasts underwent different treatments (F). (G) Cells incubation with TGF-β and Shenks for 24 h was used to analyze the ROS status by using DCFH-DA as fluorogenic probe and visualization in a confocal microscope. Bars indicate the mean ± SEM results of three assays. *P < 0.05; **P < 0.001.
