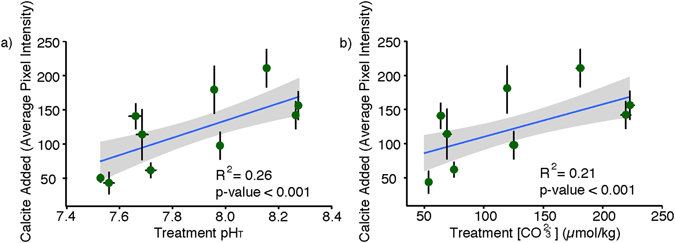
Figure 1.

Mean calcification in Globigerina bulloides as measured by calcein uptake (average pixel intensity), with respect to (a) pH and (b) [CO3 2−]. Error bars show standard deviation in both the x and y directions. These data are fit with a linear model with a 95% confidence envelope. The R2 and p-value refer to the fit of individual foraminifera to this curve (data for individual foraminifera can be found in Supplementary Data).
