
Figure 1.
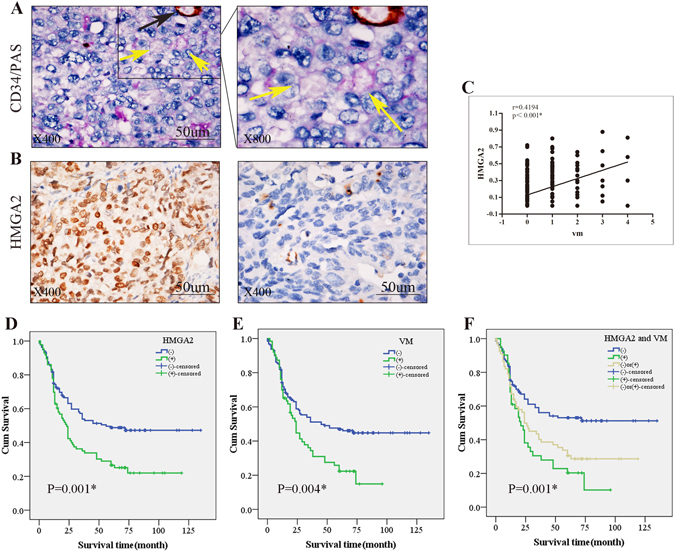
The correlation of HMGA2 expression with VM in clinical samples. (A) Phenomena of VM (yellow arrow, CD34-negative and PAS positive) and EDV (black arrow, CD34-positive and PAS-positive) in gastric carcinoma specimens; (B) IHC staining of HMGA2, the left for positive and the right for negative nuclear expression (×400, bar 50 um); (C) Quantum analysis of the correlation of HMGA2 with VM. A positive correlation between HMGA2 and VM using the Pearson correlation was observed (*P < 0.001, r = 0.4194) (D,E,F) Kaplan-Meier survival curve demonstrated that HMGA2 expression (D), VM (E), and a combination of HMGA2 expression and VM density (F) are significantly related to poor prognosis. (Log Rank χ2 = 10.693, P = 0.001; Log Rank χ2 = 8.413, P = 0.004; Log Rank χ2 = 14.494, P = 0.001).