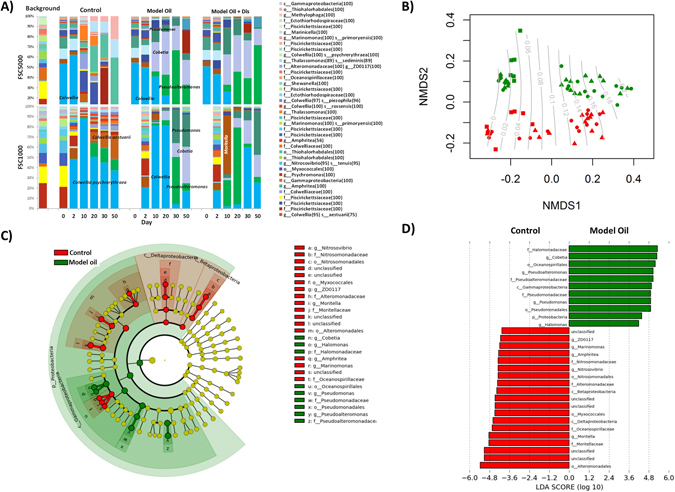
Figure 5.

Summary of bacterial communities in slurry incubations: Panel A) Relative abundance of top 50 OTUs (No sample collected for T0 FSC1000 model oil treatments as they did not differ from control T0). Panel B) nMDS based on Jaccard index; red = FSC1000 and green = FSC500; square points = control, triangles = oil + dis, and circles = oil only; contours show total mass of hydrocarbon degraded, predicted by ordisurf(). Panel C) Cladogram output from LefSe analysis showing consistently differing taxonomic groups between oil treated and control slurry incubations. Panel D) LDA effect scores for output from LefSe analysis. For panels C and D red = control and green = model oil.
