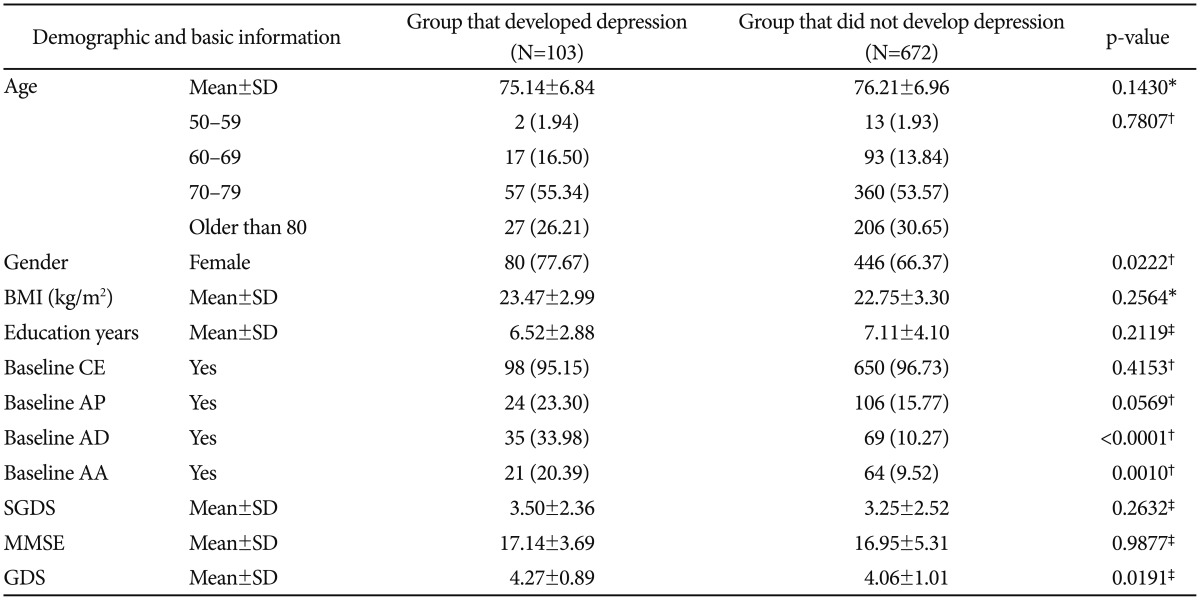
Table 3. Comparison of the characteristics of the group that developed depression and of the group that did not develop depression.
Missing data (persons): Group that developed depression, BMI (74); and Group that did not develop depression - BMI (316). *two sample t-test, †Pearson's chi-squrare test, ‡Wilcoxon's rank sum test. BMI: body mass index, CE: cognitive enhancers, AP: antipsychotic drugs, AD: antidepressants, AA: anti-anxiety drugs, SGDS: Geriatric Depression Scale-Short Form, MMSE: Mini-Mental State Examination, GDS: Global Deterioration Scale

