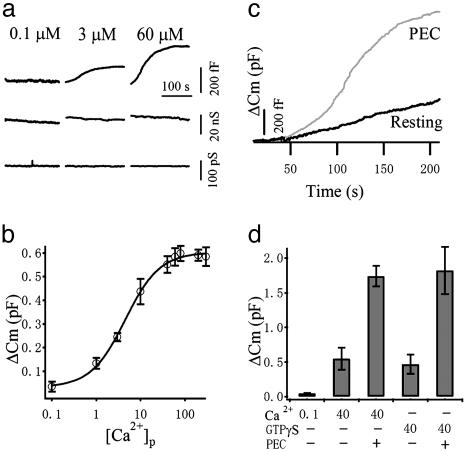
Fig. 1.
Calcium-dependent exocytosis in NK cells. (a) Example traces of Cm increase (ΔCm), Gs, and Gm from three cells patched with 0.1, 3, and 60 μM free Ca2+ in the pipette solution ([Ca2+]p), respectively. (b) The averaged total ΔCm values are plotted against [Ca2+]p (n = 13–23). The line represents a fit using a logistic equation, which gives an EC50 of 4.5 μM. (c) Example ΔCm traces from resting and PEC-activated NK cells demonstrating dramatic augmentation of the secretory response after PEC stimulation. (d) The mean ± SEM values (n = 11–27) from resting cells recorded with 0.1 and 40 μM [Ca2+]p and 40 μM GTPγS are compared with that of PEC-activated NK cells stimulated with 40 μM [Ca2+]p and 40 μM GTPγS.

