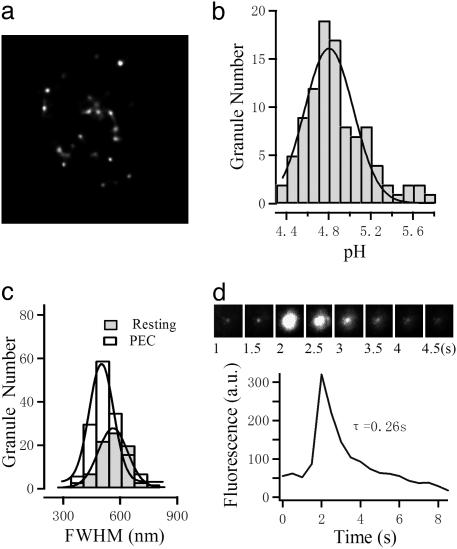
Fig. 3.
AO-labeled SLs in NK cells. (a) An example section of an AO-stained NK cell after PEC activation. Fluorescence spots are clearly distinguishable. (Scale bar, 5 μm.) (b) The pH values of individual granules were determined, and their distribution demonstrates a single peak at 4.8. (c) The distributions of the FWHM of spots from resting (filled bar) and PEC-activated (open bar) NK cells are compared. Solid lines represent respective Gaussian fits. The FWHMs were measured from the fluorescence profile of individual spots, which also follow a Gaussian equation. (d) Fusion of a single AO-labeled spot revealed by total internal reflection fluorescence microscopy imaging.

