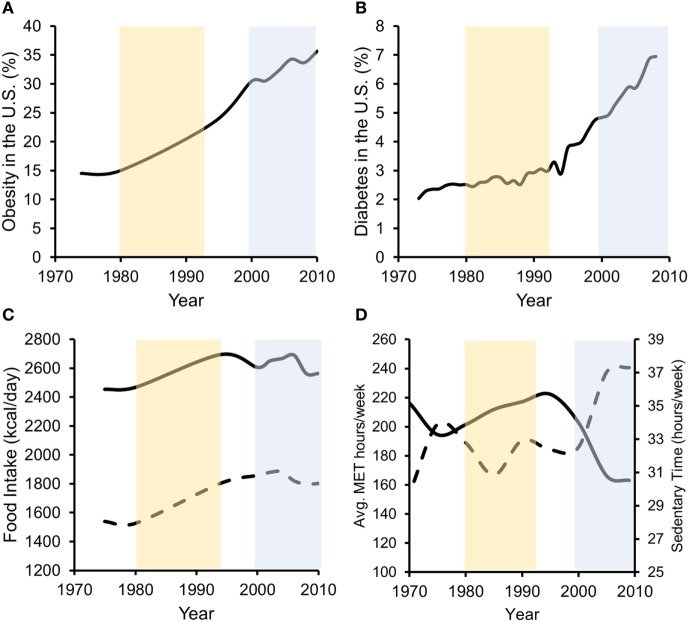
Figure 1.
Data suggest that both increases in energy intake and reductions in energy expenditure associate with increased obesity prevalence, while in later years, decreased energy expenditure more strongly associates with T2D prevalence. Percentage of US adults with obesity (A) or diagnosed with type 2 diabetes (B) over the past ~40 years. (C) Unadjusted food intake for male (solid line) and female (dashed line) adults in the US during the same time frame. (D) Physical activity (solid line/left axis) [average metabolic equivalent (MET) hours per week] and physical inactivity (dashed line/right axis) (hours per week of sedentary time) performed by US adults. Obesity data redrawn from Ref. (48, 51), diabetes data from the CDC (52), food intake data from Ref. (53), and physical activity data from Ref. (54).

