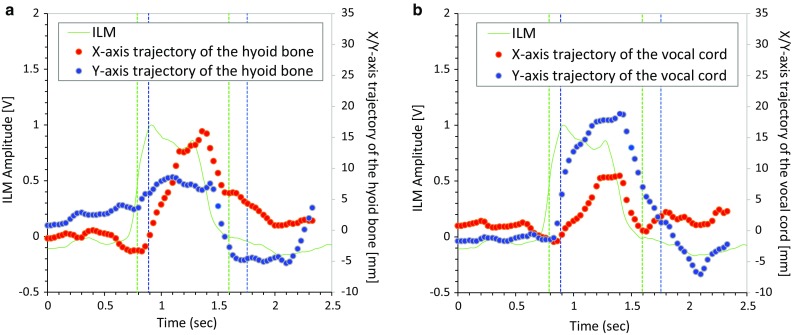
Fig. 10.

Comparison of integrated laryngeal motion (ILM) signal and trajectories of the hyoid bone (a) and the vocal cord (b) tracked from videofluoroscopy (VF) images. In each panel, the blue dots are the X-axis trajectory, the red dots represent the Y-axis trajectory, and the green line is ILM by our monitor device. Start point and end points of laryngeal activation duration (LAD) and pharyngeal response duration (PRD) are shown in green and blue vertical lines, respectively
