FIGURE 4.

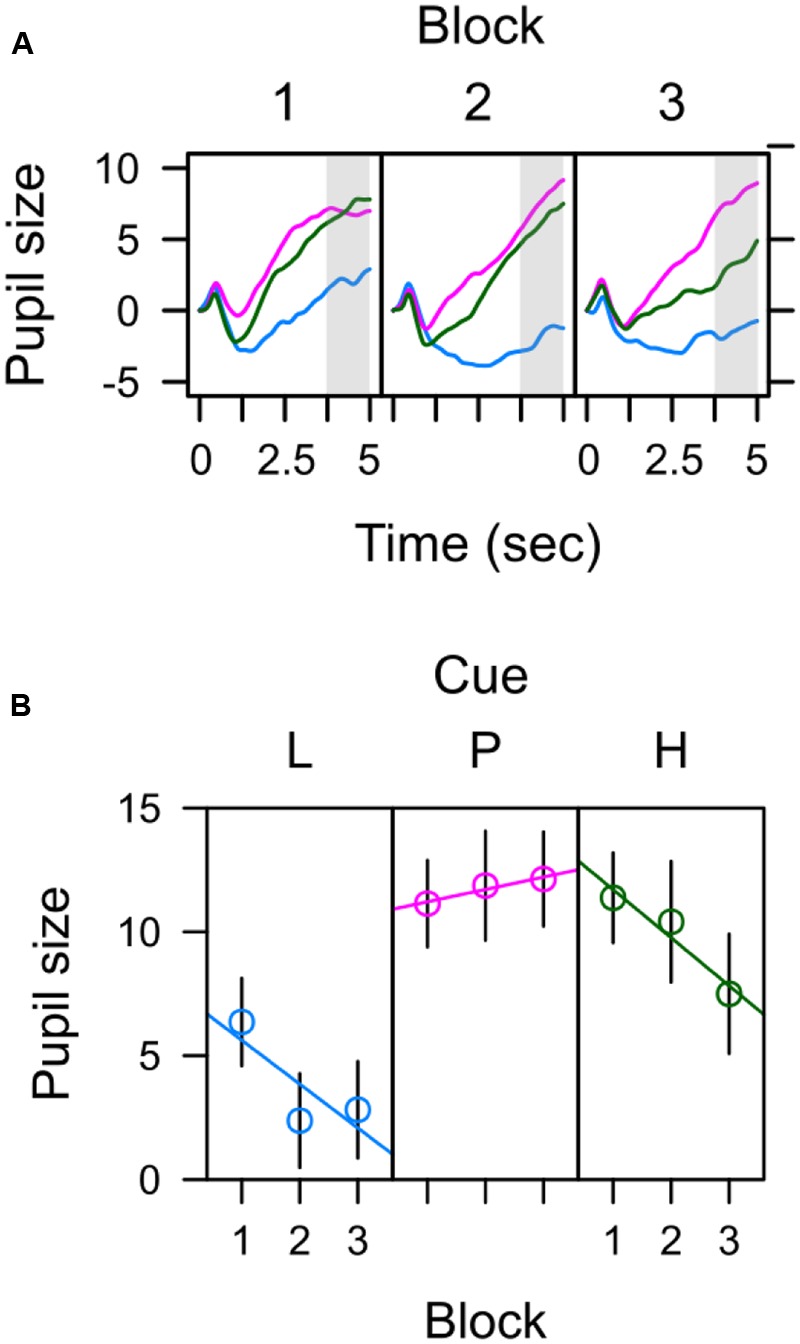
Pupil size elicited by low (blue), partial (red), and high (green) expectancy of electric shock. (A) Average pupil traces in the 5-s CS interval (B) Pre-US pupil size during the last 1250 ms preceding the US (3750–5000 ms).

Pupil size elicited by low (blue), partial (red), and high (green) expectancy of electric shock. (A) Average pupil traces in the 5-s CS interval (B) Pre-US pupil size during the last 1250 ms preceding the US (3750–5000 ms).