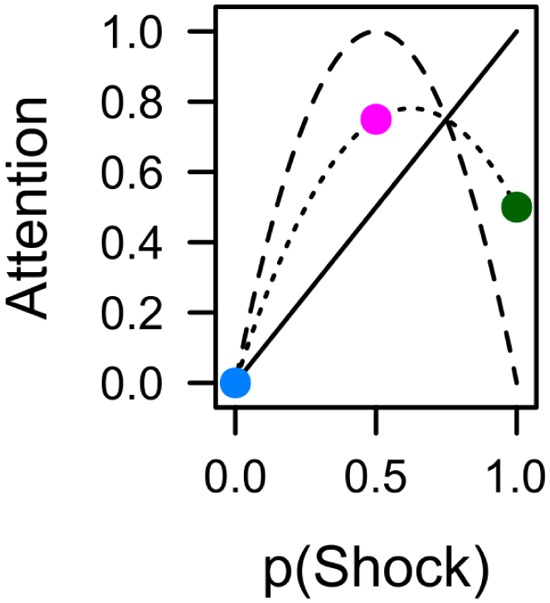
FIGURE 7.

The average (dotted line) of shock expectancy (solid line) and shock uncertainty (dashed line) yields a simple integration of both values that is in accord with pupil dilation (Figure 4) and total dwell time (Figure 5A) during conditioning, as well as capture duration in the subsequent search task (Figure 6B). Colors indicate contingencies of 0% (blue), 50% (red), and 100% (green) from the current experiment.
