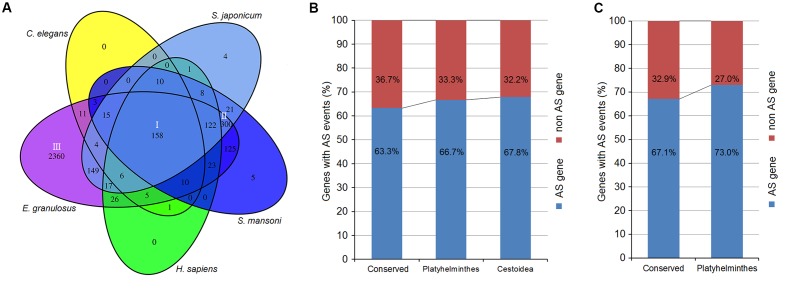
FIGURE 6.
Sequence conservation analysis of Echinococcus AS genes. (A) Venn diagram of Echinococcus AS genes with homologous genes in the five organisms. (B) The percentages of E. granulosus genes with AS events from the three groups. (C) The percentages of S. japonicum genes with AS events from groups I and II.

