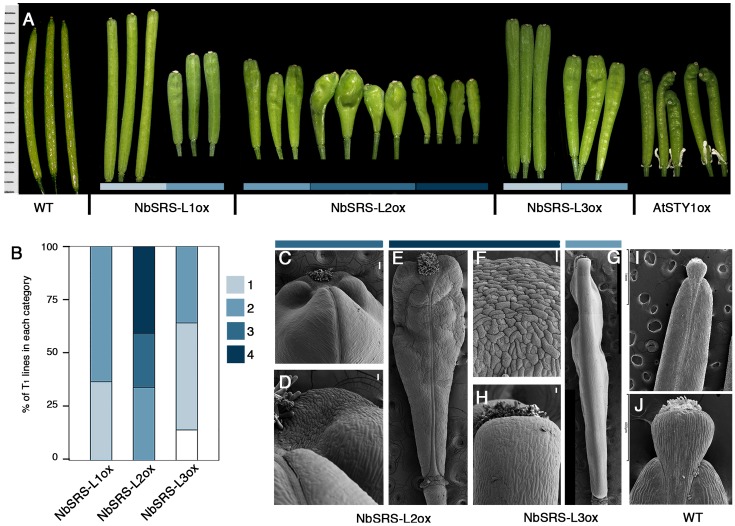
FIGURE 3.
Phenotypes of Arabidopsis transgenic lines overexpressing the NbSRS-L genes. (A) Three to five fruits from a single plant representative of the different phenotypic categories and genotypes are shown. The AtSTYox fruits belong to a transgenic line obtained from E. Sundberg’s lab (Kuusk et al., 2002). (B) Proportions of the different phenotypic categories among the T1 transgenic lines obtained for each construct, where 1 (light blue) represents the weakest phenotype and 4 (dark blue) the strongest phenotype. White color corresponds to plants showing no conspicuous differences respect to wild type. (C–J) Scanning electron micrographs of fruits from selected genotypes and categories. (C,D) Fruits from 35S::NbSRS-L2 lines in category 3. (C) Apical part of the fruit. (D) Close up of the style/valve area. While cells retain their identity, there is no clear demarcation between the two zones. (E) Fruit from a 35S::NbSRS-L2 line in category 4. (F) Close up of the apical part of the fruit shown in (E). All the cells have a crenelated surface with the typical morphology of style cells and no valve cells can be distinguished. (G) Lateral view of a 35S::NbSRS-L3 fruit in category 2. The valves grow laterally to the same level as the stigma and style and have a square morphology. (H) Close up of the apical valve cells of the fruit shown in panel (G). All cells have valve identity and no ectopic formation of style cells can be observed. (I) Wild type fruit. (J) Close up of the apical domain, where the demarcation of stigma, style, and valves is clearly seen. Bars in (C–G): 50 μm.

