FIGURE 4.
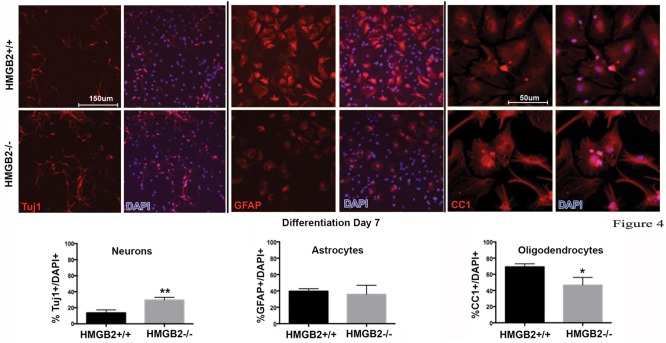
Ratios of neural and glial cell altered in HMGB2-/- SVZ cultures at day 7 of differentiation. NPCs were cultured in eight-well chamber slides with growth factor-free media and allowed to differentiate. Chamber slides from HMGB2+/+ and HMGB2-/- NPCs stained for the immature neuronal marker Tuj1, all results represented as percentage of Tuj1+ (red) cells to all DAPI+ (blue) nuclei. Chamber slides from HMGB2+/+ and HMGB2-/- NPCs stained for the astrocyte marker GFAP, all results represented as percentage of GFAP+ (red) cells to all DAPI+ (blue) nuclei. n = 3 biological replicates per genotype, 60 cells were counted per biological replicate. Chamber slides from HMGB2+/+ and HMGB2-/- NPCs stained for the oligodendrocyte marker CC1, all results represented as percentage of CC1+ (red) cells to all DAPI+ (blue) nuclei. n = 3 biological replicates per genotype. ∗∗Tuj1 p = 0.0054, ∗CC1 p = 0.0189. Scale bar = 150 μm, except for the CC1 images where the scale bar indicates 50 μm.

