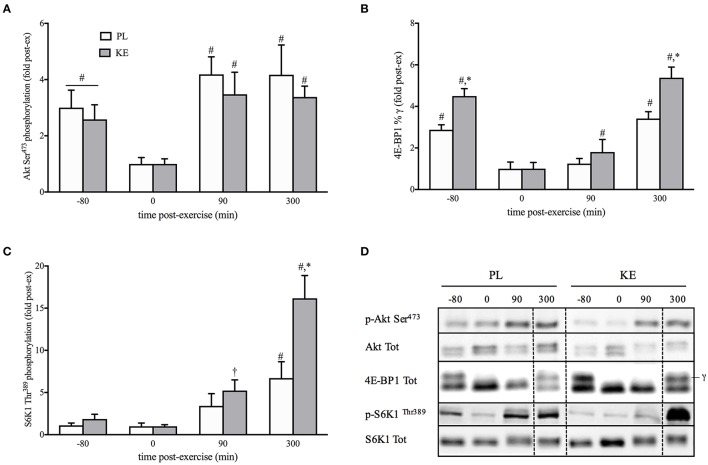
Figure 4.
Effect of nutritional ketosis on the Akt/mTORC1 pathway. Data are means ± SEM (n = 7) for Akt (A), 4E-BP1 (B), and S6K1 (C) phosphorylation measured in m. vastus lateralis at baseline (−80) and after 0, 90, and 300 min of recovery. (D) Representative blots; vertical dotted line indicates a repositioned gel lane from the same blot. During recovery, either PL or KE was ingested together with a high-dose protein-carbohydrate solution *p < 0.05 KE vs. PL at time points indicated; #p < 0.05, †p < 0.10 vs. 0 min post-exercise at conditions indicated.

