
Figure 5.
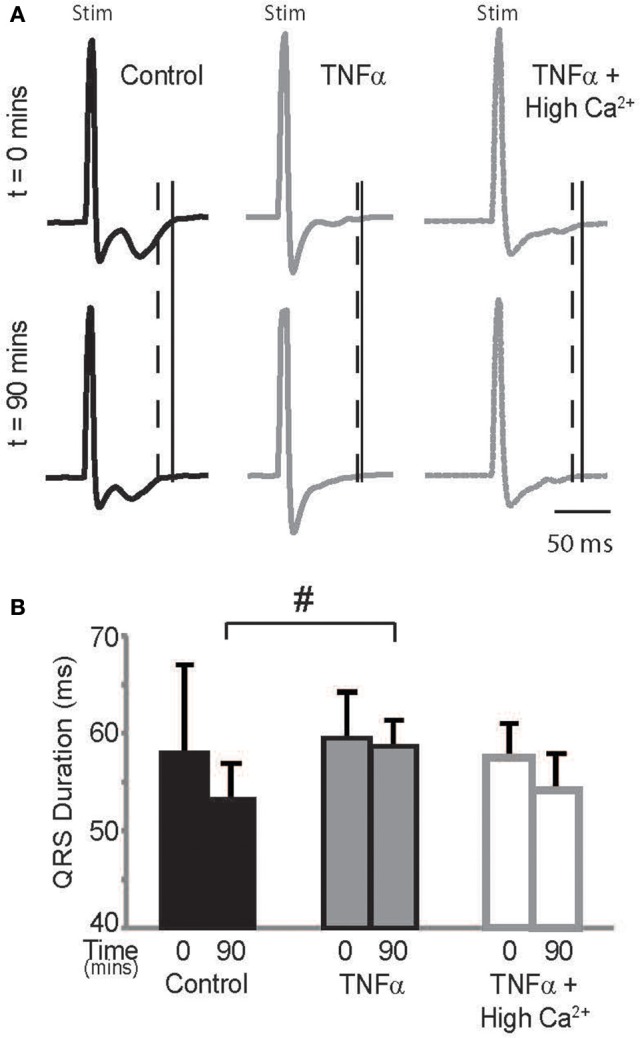
ECG (A) Paced QRS complexes from volume-conducted ECG traces recorded from control, TNFα and TNFα + high calcium perfused hearts. Solid vertical lines indicate end of QRS of ECGs from t = 0 mins and dashed vertical lines indicate end of QRS and T waves of ECGs from t = 90 mins. “Stim” indicates stimulus artifacts. (B) Summary of QRS duration. #indicates p < 0.05 relative to control (unpaired).