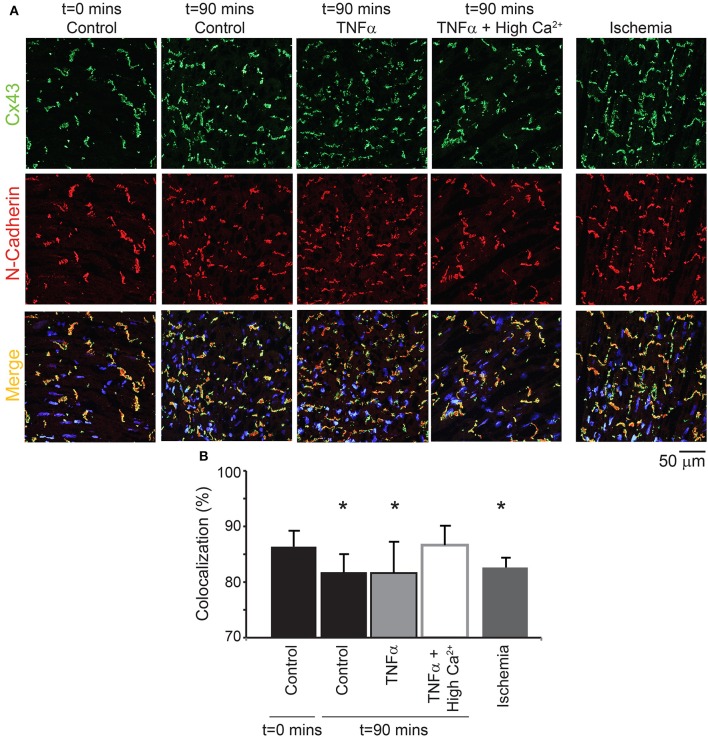
Figure 8.
Cx43 distribution modulation by TNFα (A) Representative samples stained for Cx43 (green) and N-Cadherin (red, to mark the intercalated disc). The colocalization of the two signals is indicated in yellow. Samples from control, TNFα, and TNFα + high calcium were compared and 1 h of no flow ischemia was used as a positive control. (B) Summary data of percent Cx43 colocalized with N-Cadherin. *Indicates p < 0.05 relative to t = 0 mins by unpaired comparison.

