Fig. 3.
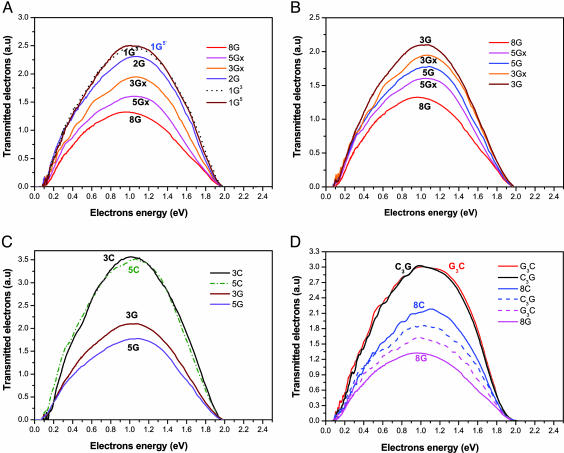
Electron transmission spectra. (A) The kinetic energy spectra of photoelectrons transmitted through monolayers made of ss DNA oligomers containing 15 bases with various numbers of G (the rest being A bases). The photon energy is 6.4 eV. The abbreviations of the strand sequences are given in Fig. 1. (B) The effect of clustering of the G bases on the transmission signal. When the G bases are clustered together (3Gx and 5Gx), the transmission yield is reduced compared with the oligomers in which the G is separated by A bases. (C) The kinetic energy spectra of photoelectrons transmitted through monolayers made of various oligomers (see Fig. 1 for the assignment). The transmission through layers made of the 3C and 5C oligomers are compared with 3G and 5G. (D) Kinetic energy spectra of photoelectrons transmitted through layers made of ds DNA (red and black solid lines). For a comparison, the transmission through layers made of ss DNA is shown (8C and 8G). The curves with the dashed lines correspond to the spectra obtained after washing the ds samples with pure water to induce denaturation.

