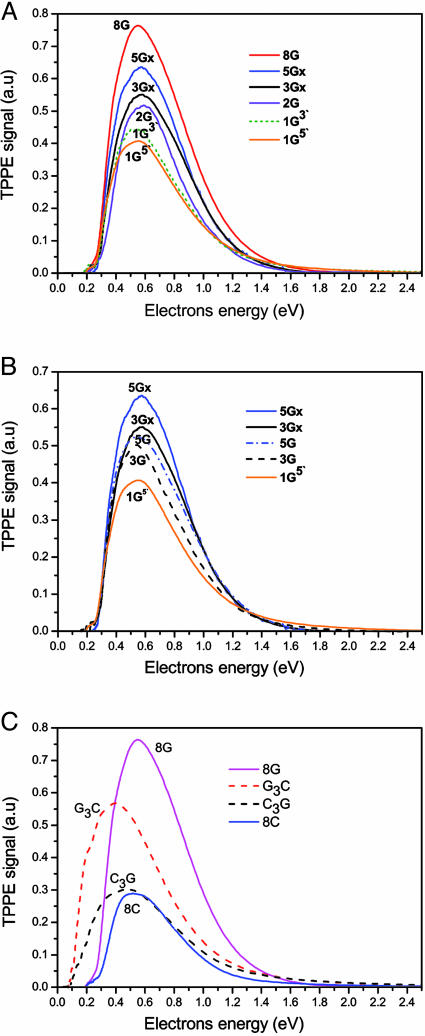
Fig. 5.
Kinetic energy spectra of electrons ejected by a TPPE process. The photon energy is 3.55 eV. (A) The TPPE spectra obtained from monolayers made of ss DNA oligomers containing 15 bases with various numbers of G (the rest being A bases). (B) TPPE spectra demonstrating the effect on the electron transmission caused by clustering of the G bases (5Gx and 3Gx) versus them being separated by A bases (5G and 3G). (C) TPPE spectra from layers made of ds DNA (dashed lines) versus layers made from ss oligomers. Note the shift in the peak of the TPPE spectra for the ds layers compared to the ss layers.

