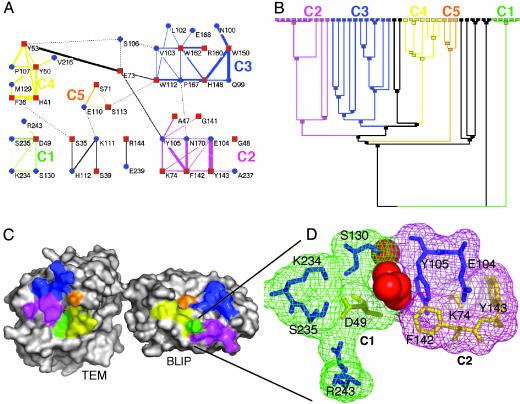
Fig. 1.
Cluster analysis of the TEM1–BLIP interface. The interactions between residues located within the interface were extracted by using the csu package (22) [for parameters, see Table 3; clustered with the spc 3.3.13 tool (23)]. The interface was divided into five clusters of interactions, shown in A as a connectivity map, with the dendogram given in B, where the final nodes are the residues. A minimum of three residues is needed to form a cluster. The black lines indicate two residue interactions. (C) The location of the clusters is marked on the protein surfaces. An enlarged view of the two clusters (C1 and C2) is shown in D and includes the four water molecules separating the two clusters. The same color-coding is preserved throughout Fig. 1. In A, red squares mark BLIP residues, and blue circles mark TEM1 residues. In D, blue residues are for TEM1 and yellow for BLIP.

