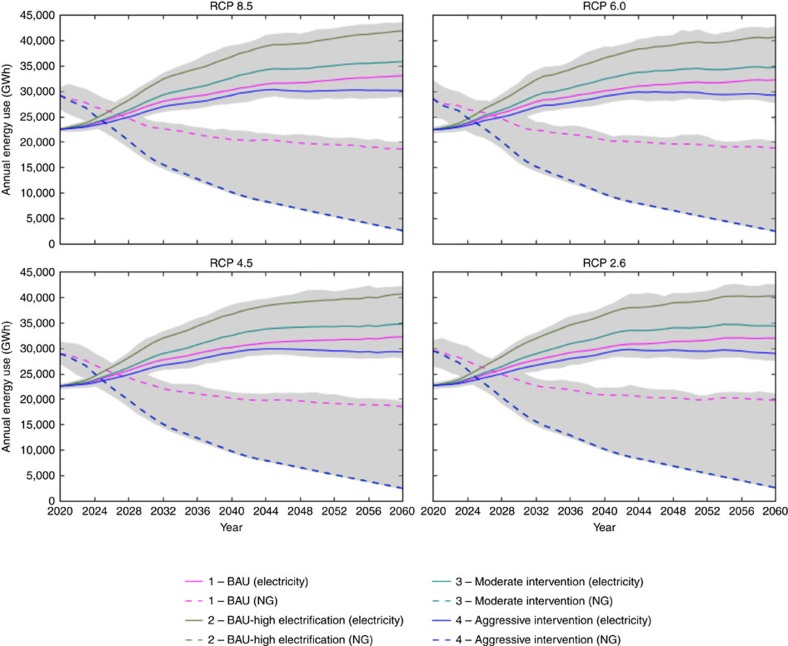
Figure 2. Total energy use for all four RCPs and scenarios between 2020 and 2060.
Electricity demand is represented by solid lines and natural gas demand by dashed lines (note: scenarios 2 and 3 are exactly aligned with scenario 4). The grey area shows the variability in our forecast due to the different general circulation models.

