Fig. 4.
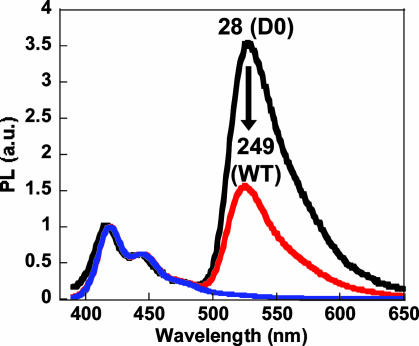
Fluorescence of PNA-FL annealed to complementary 28 (black, D0) and 249 (red, WT) base ssDNA targets ([PNA/ssDNA] = 1 × 10⁻⁸ M) upon addition and excitation (λex = 380 nm) of the CP ([CP] = 2 × 10⁻⁷ M) in 30 mM potassium phosphate buffer, pH 7.4. The noncomplementary (28 base, D3) DNA target is shown in blue for reference. The arrow indicates the drop in the relative FL-to-CP emission peak ratio between the two different DNA target lengths.

