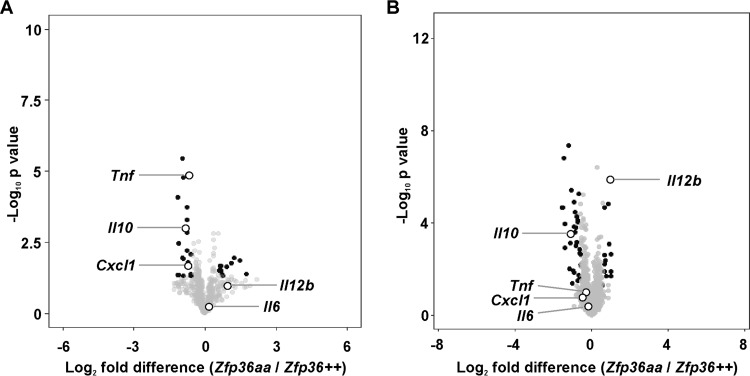
FIG 1.
Differentially expressed transcripts in Zfp36aa/aa M-BMMs. M-BMMs were generated from 3 Zfp36+/+ and 3 Zfp36aa/aa mice and treated with 10 ng/ml LPS for 1 h (A) or 4 h (B). RNA was isolated, and transcript abundance was analyzed by using Agilent microarrays and Partek Genomics Suite. Transcripts expressed above an arbitrary threshold of 200 RMA in at least two replicates and demonstrating upregulation by LPS (>2 times; P < 0.05) were selected for display. Data are illustrated in the form of volcano plots, in which transcripts with a >1.5-fold difference in expression levels between Zfp36+/+ and Zfp36aa/aa M-BMMs and a corrected P value of <0.05 are shaded black. Underexpressed transcripts are to the left of the origin. Several transcripts are highlighted.

