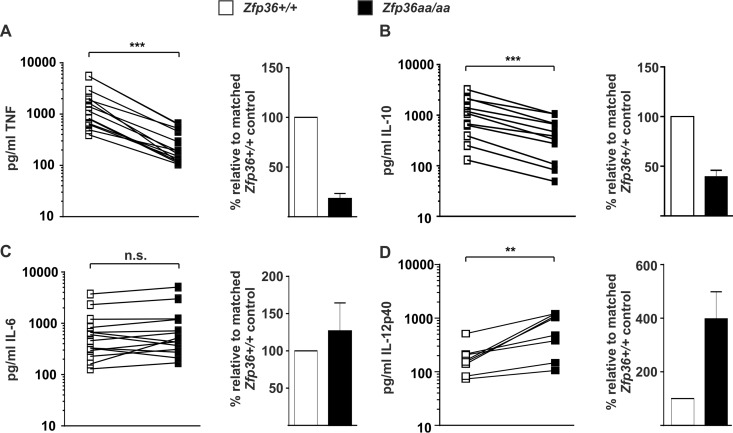
FIG 2.
Expression of TNF, IL-10, IL-6, and IL-12p40 proteins by Zfp36+/+ and Zfp36aa/aa M-BMMs. Matched Zfp36+/+ and Zfp36aa/aa M-BMMs were cultured in 24-, 12-, or 6-well dishes and stimulated with 10 ng/ml LPS for 4 h. ELISAs or multiplex bead assays were used to measure TNF (A), IL-10 (B), IL-6 (C), and IL-12p40 (D) levels. In the cases of TNF and IL-6, 5 of 14 experiments employed matched Zfp36+/+ and Zfp36aa/aa littermates. All other experiments employed at least three mice of each genotype, with mean cytokine concentrations being plotted. Cytokine quantities expressed by matched Zfp36+/+ and Zfp36aa/aa M-BMMs or sets of M-BMMs are connected by lines. The graphs on the right show mean cytokine expression levels in Zfp36aa/aa M-BMMs relative to those in matched Zfp36+/+ controls. n.s., not statistically significant; ***, P < 0.005; **, P < 0.01 (by a Wilcoxon matched-pair test).

