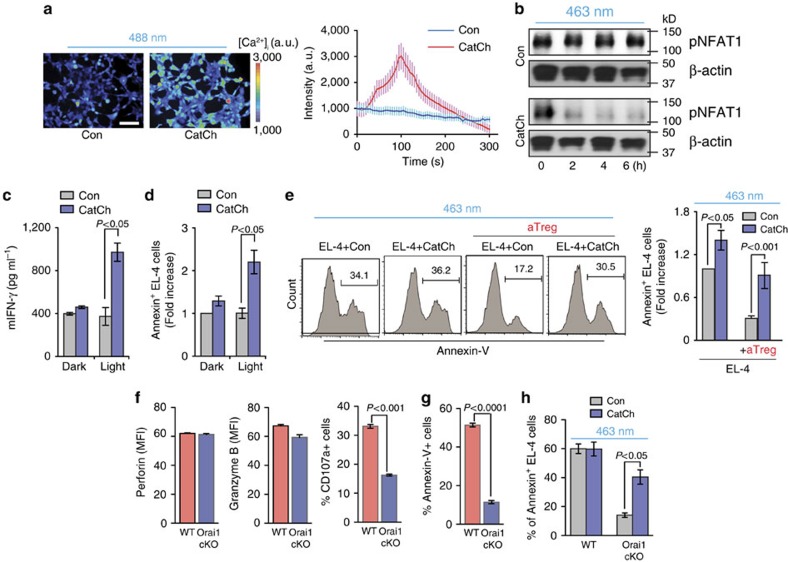
Figure 3. Optical control of intracellular Ca2+ signal in CD8+ T cells.
(a) Representative fluorescence images of Fluo-4/AM-loaded HEK293 cells during light activation. Scale bar, 100 μm. Intensity traces of mock-transfected cells (Con; n=16) and cells transiently transfected with CatCh (n=20). (b) Western blot analysis of NFAT1 phosphorylation in CatCh-expressing OT-I CD8+ T cells after light stimulation for the indicated time. (c,d) IFN-γ secretion and cytotoxicity of CatCh-expressing OT-I CD8+ T cells in the presence of G4 peptide-loaded EL-4 cells with or without light stimulation (n=3). (e) Killing of N4 peptide-loaded EL-4 cells after light stimulation of CatCh- or GFP-expressing OT-I CD8+ T cells in the presence or absence of aTregs (n=3). (f) Expression of perforin, granzyme B and CD107a on WT or Orai1-cKO CD8+ T cells after incubation with N4 peptide-loaded EL-4 cells at a 1:1 ratio for 6 h (n=3). (g) Killing of N4 peptide loaded EL-4 cells by WT or Orai1-cKO CD8+ T cells (n=6). (h) Killing of N4 peptide loaded EL-4 cells by CatCh-expressing WT or Orai1-cKO CD8+ T cells with light stimulation (463 nm) (n=3). Throughout, data are the mean±s.e.m. and were analysed by two-tailed Student's t-test.

