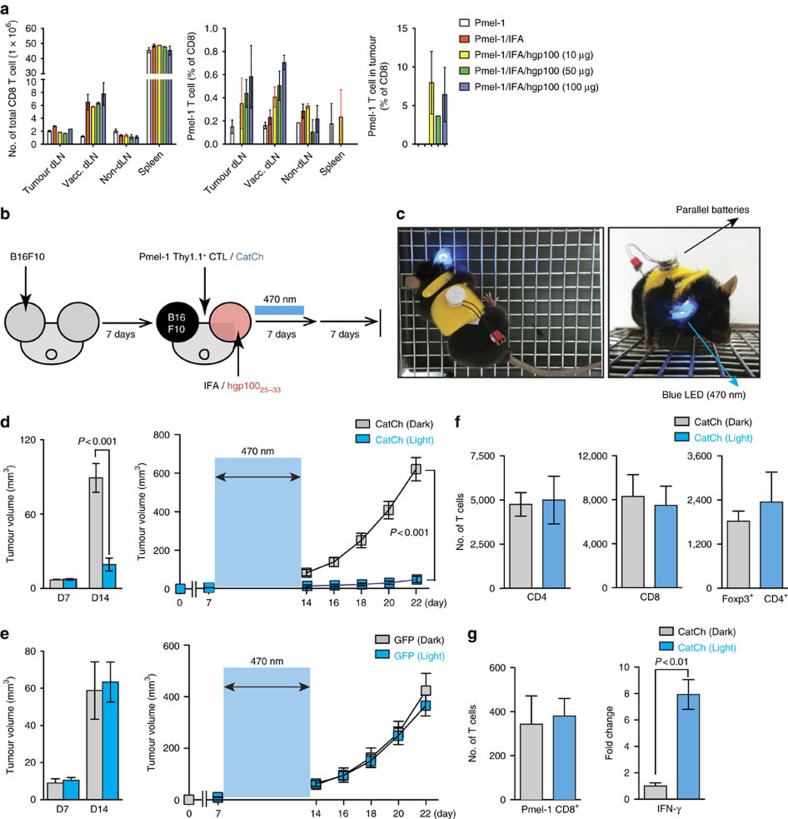
Figure 4. Optical control of Ca2+ signal in adoptively transferred Pmel-1 T cells.
(a) Flow cytometry analysis of total T cell populations (day 14) in mice with B16 murine melanoma. Where indicated, mice were vaccinated by intradermal injection of hgp100/IFA. (b) Experimental design of the studies of optical control of Ca2+ signal in vivo. (c) Freely moving mouse with battery-powered wireless LED attached on the ear skin. (d) Size and growth curves of B16 tumours in mice treated with adoptive transfer of CatCh-expressing Pmel-1 CD8+ T cells with (optical LED+light) or without (optical LED+dark) light stimulation (light, n=6; dark, n=6). The light stimulation (470-nm) times are denoted with a blue box. (e) Size and growth curves of B16 tumours in mice treated with adoptive transfer of GFP-expressing Pmel-1 CD8+ T cells with (optical LED+light) or without (optical LED+dark) light stimulation (light, n=7; dark, n=6). The light stimulation (470-nm) times are denoted with a blue box. (f) Flow cytometry analysis of total CD4+ T cells, CD8+ T cells, and CD4+ Foxp3+ Treg numbers (per 1 × 10⁶ total cells) in B16 tumours on day 14 (after 7 days light stimulation) (light, n=5; dark, n=8). (g) Flow cytometry analysis of total Pmel-1 T cell number (per 1 × 10⁶ total cells) (light, n=5; dark, n=8) and expression of IFN-γ B16 tumours was analysed by qPCR (n=3). Throughout, data are the mean±s.e.m. and were analysed by two-tailed Student's t-test or One-Way ANOVA with a Bonferonni post-test.

