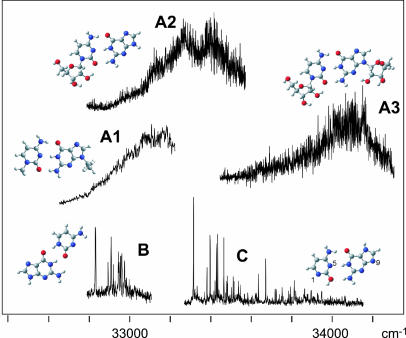
Fig. 2.
REMPI spectra recorded at the mass of guanine–cytosine (B and C), 9-ethylguanine-1-methylcytosine (A1), guanine–cytidine (A2), and guanosine–cytidine (A3). All spectra are one-color, two-photon spectra, except B, which is a two-color spectrum with 266 nm for the ionization laser. All spectra were recorded at the parent mass of the respective cluster. The cluster structures in the figure were optimized at the DFT (B3LYP/6–311G**) level.

