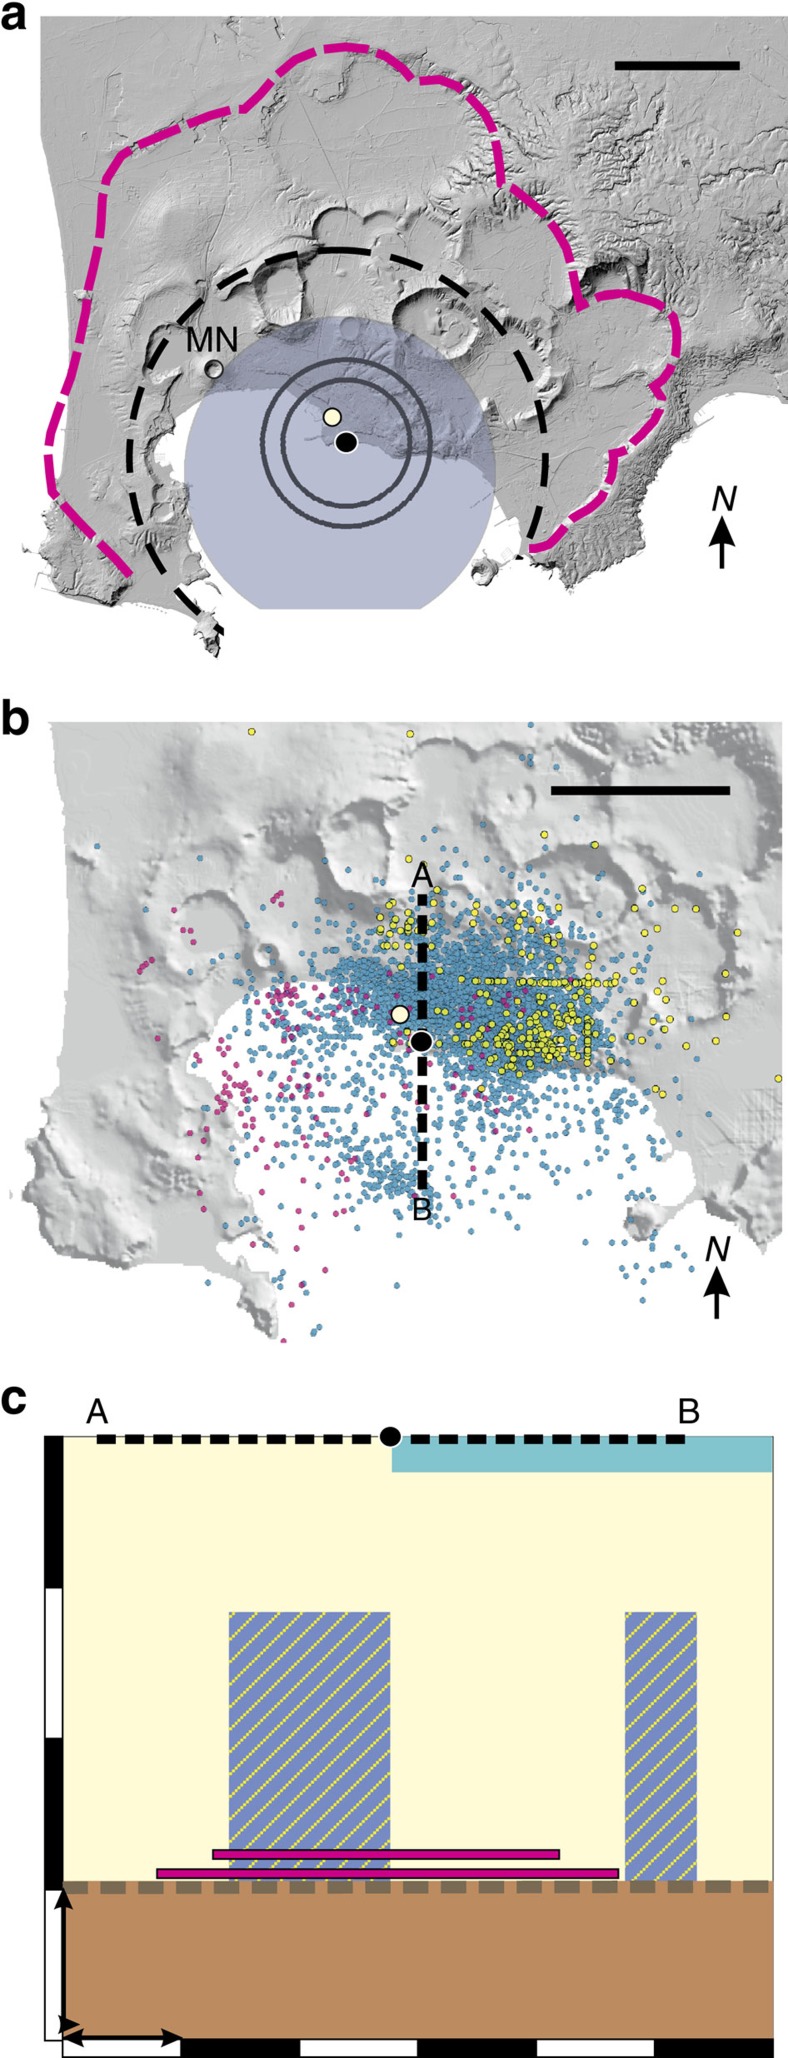
Figure 1. Structure and VT seismicity in Campi Flegrei.
(a) The active ring-fault zone encloses the principal area of caldera collapse (blue, shaded) associated with the eruption of the Neapolitan Yellow Tuff 15.6 kyr ago. Upward ground movements since 1969 have extended 5 km (black, dashed curve) around the centre of uplift (black filled circle) and within the perimeter (magenta, dashed curve) defined by the proposed collapse associated with the eruption of the Campanian Ignimbrite 39 kyr ago54,55,56. They are consistent with the intrusion of sills at depths of c. 3 km during 1969–1972 (inner black circle) and 1982–1984 (outer black circle). The Serapeo (white filled circle) in Pozzuoli is shown for reference. The scale bar is 3 km. (b) Epicentres of VT events57 across Campi Flegrei for the intervals 1972–1974 (pink circles), 1983–1984 (blue circles) and 2005–2015 (yellow circles). The dashed line A–B shows the trace of the cross-section in c. The scale bar is 3 km. (c) Schematic north–south cross-section passing through the centre of uplift. The upper crust (pale yellow) that contains the hydrothermal system is underlain by bedrock (brown) beneath a thermo-metamorphic horizon (dashed brown line) at a depth of c. 3 km (ref. 56). Magmatic sills (magenta) were intruded at depths of c. 2.5 and 2.75 km during the 1969–1972 and 1982–1984 emergencies, respectively17. VT seismicity in 1982–1984 was concentrated inland from Pozzuoli and c. 2.5 km offshore54, near the southern periphery of the inferred 1982–1984 sill (blue shading with yellow lines). The sea is shown in turquoise. The vertical thicknesses of the sills and sea are not to scale. The arrows show lengths of 1 km.

